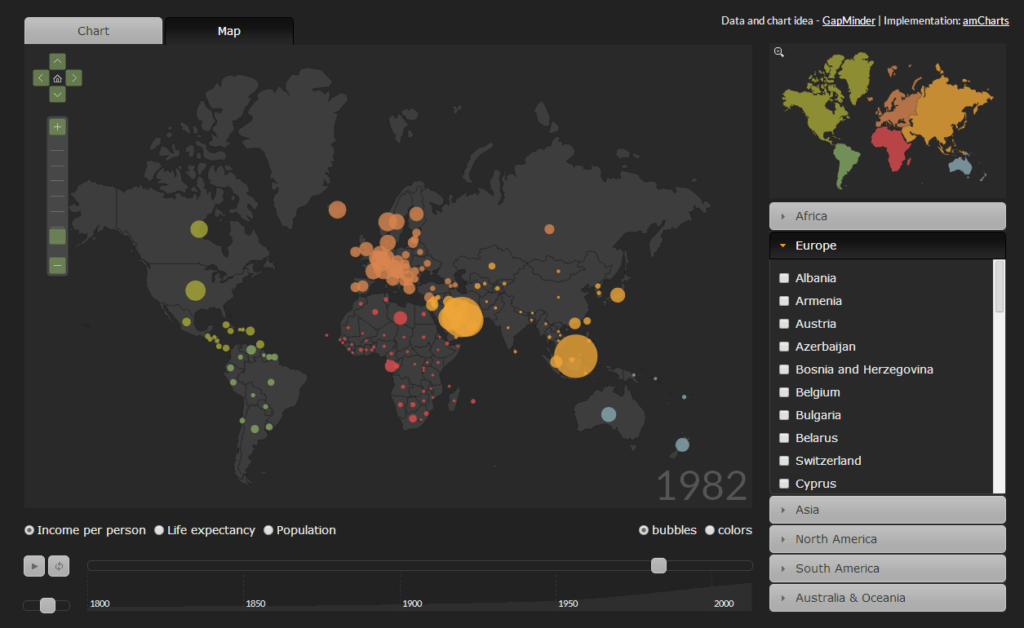
Motion-chart and Motion-map demo
If you do something with stats, you must know Gapminder and it’s amazing data visualization widget, The World. And even if you don’t like numbers, most likely you’ve seen one of the videos with Hans Rosling, this one is the one of the best. As we produce charts and maps, it’s quite often that people ask us whether they can do the same charts as Gapminder’s with amCharts. The simple answer is yes, you can. The idea is very simple – you change the data of the chart or map and redraw it. If you do it very often, you will get animation effect. As more and more people were asking to produce a demo of such chart, we had no choice and did it, here is motion-chart and motion-map demo. Of course, it is not as good as the one Gapminder uses, but we will be improving it. This is not a separate chart type we sell, it’s just a combination of several charts and maps, and all the interaction and set-up is within the html file. It is well commented, so feel free to view source to check how this was done. Later we will prepare some tutorials of simple steps required to produce motion-chart or map.