DataViz Tip #16: Keep It Simple, Stupid
As someone responsible for visualizing data, you may lose track of what’s important in the task. Sometimes your goal is to build something visually stunning to impress the public, but most times your goal is to make information easy to understand and analyze. That’s where remembering the KISS principle is very important.
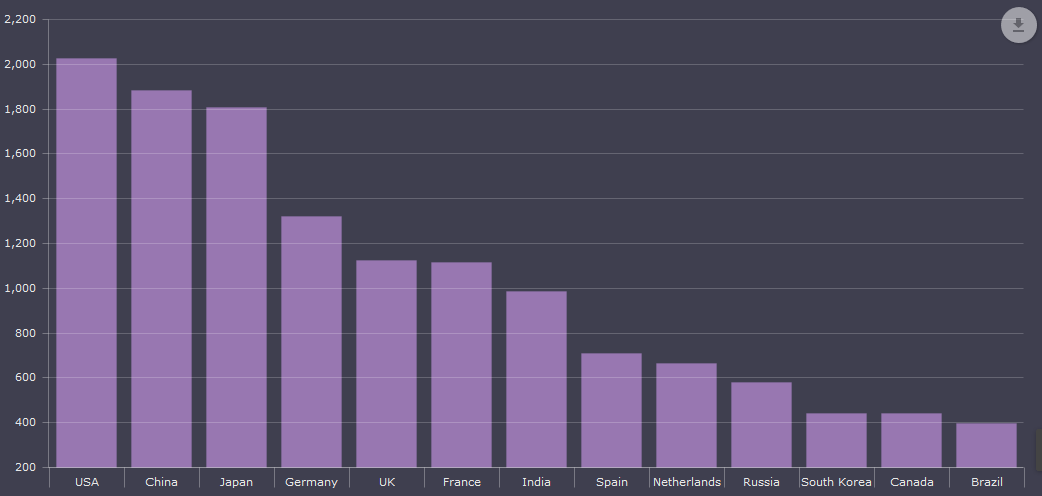
In the data visualization world, this means that you should probably default to a bar chart. Or, if you have data-over-time, to a line chart. Only if you see that these types can’t represent your data accurately or easy to digest should you move on to other options.
In any case, try to deconstruct your data to digestible bits and visualize them using chart types most people understand. These, in addition to bar/column and line/area charts, include scatter/bubble and pie/donut charts.