DataViz Tip #25: Credit Sources, Disclose Assumptions
Your data visualizations are based on data (duh!). This data comes from somewhere. When it’s not your data, remember to credit the source. And even when it’s yours a good explanation of where this data comes from and how it was collected goes a long way towards setting the playing field and expectations for the user.
You likely know some aspects of data collection or the sample set that skews the result in one direction or other. Maybe some data is missing and not taken into account in your charts. Possibly, you made assumptions that are obvious to you and most likely right but aren’t backed by any data.
Disclosing all this information in the footnotes or anywhere else, helps your viewers analyze your visualizations with complete background information and mitigates the possibility of them dismissing your findings altogether due to their own assumptions and lack of addressing them from your side.
Case in point…
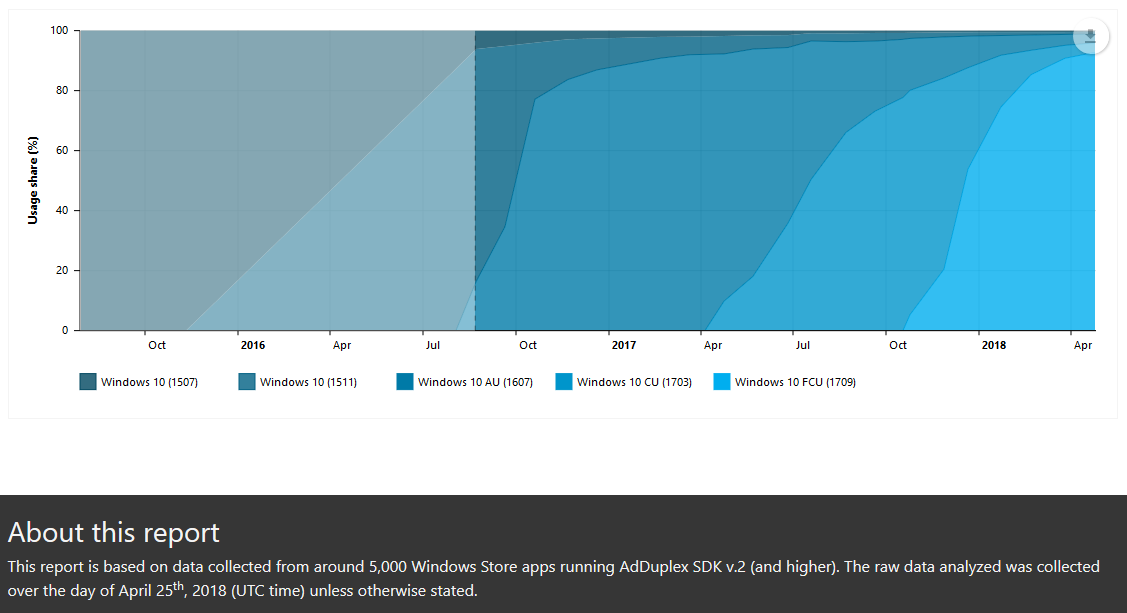
Every month I work on statistics reports for AdDuplex. The data is collected from apps utilizing the company’s advertising SDK. This information is disclosed in the footer but the problem probably is that it stops at the facts and doesn’t explain what effects this may have on the findings. As a result, some people dismiss the findings as inaccurate due to the fact that not many enterprises would run ad-supported apps and enterprises make up a big chunk of all Windows PCs. I intend to expand the data source section with a disclaimer of possible skew in the data in the future reports and, hopefully, alleviate part of these complaints.
We are giving away a great data visualization book each month! Subscribe to our newsletter to get monthly tips like the one above and you’ll be automatically entered in the sweepstakes to win an awesome book.