DataViz Tip #5: Sketch and Prototype Your Charts Before Coding
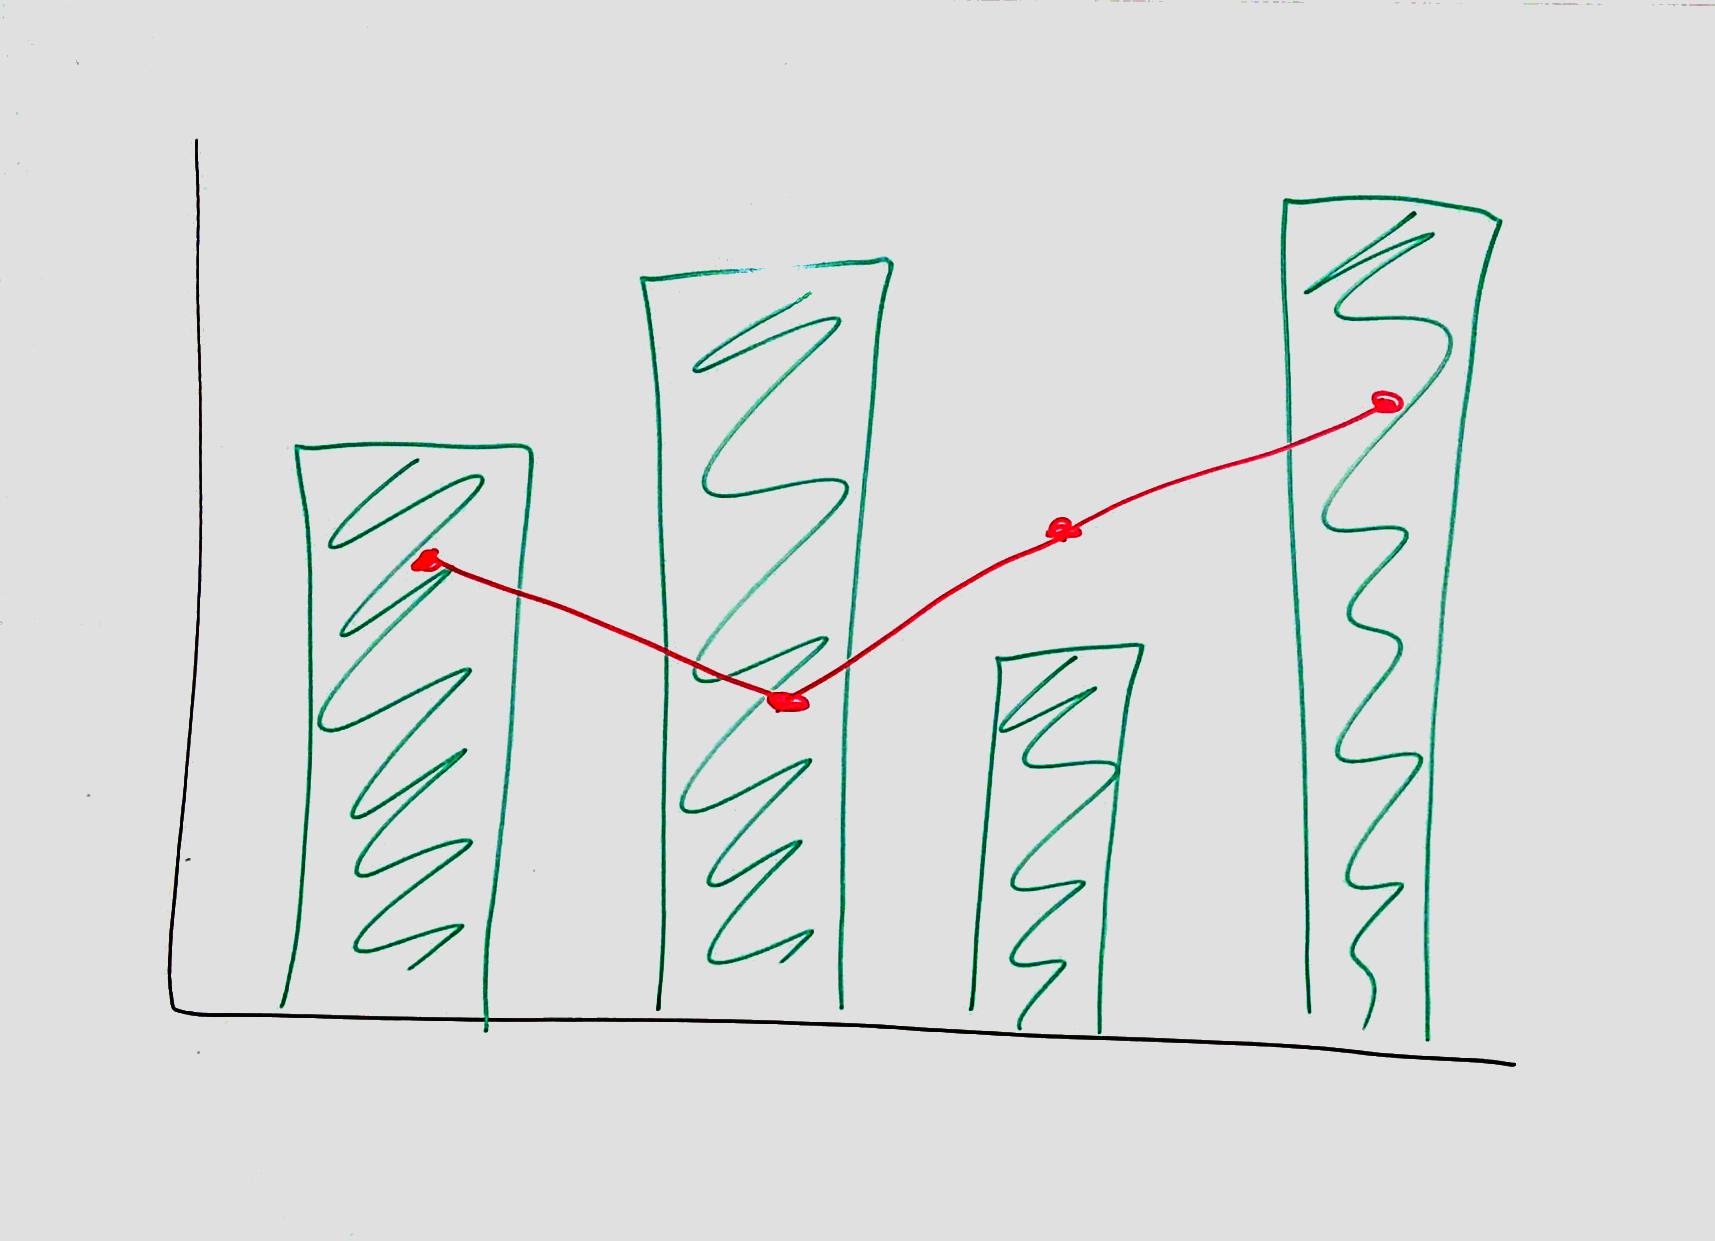
After seeing beautiful amCharts demos, you may have an urge to drop straight into your code editor and start coding. While sometimes you know precisely what chart represents your data best, other times it may not be as obvious. While developing a visualization with amCharts is easy, it is still more work than doing a quick sketch on paper, whiteboard, or your Surface, iPad Pro or Galaxy Note.
When you are done with sketching, or if your dataset is too big or too complex to visualize with pen and paper, you can prototype your charts with good old Excel. It will not produce the most beautiful or interactive results, but it will let you switch chart types quickly and help you spot insights or irregularities in your data.
Finally, use amCharts Live Editor to jumpstart your final visualization.