DataViz Tip #7: Tools to Transform Data
Last week we have shown that transforming our data can help us create different and, likely, better visualizations. Let’s cover some tools that can help us in the process…
Pivot Tables
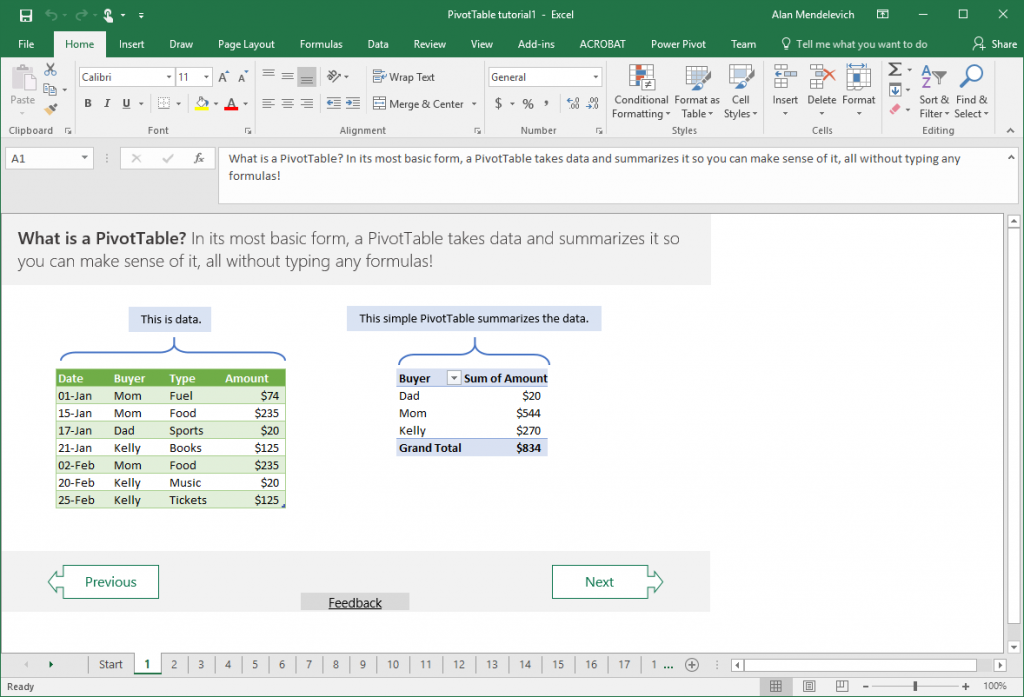
Pivot Tables is a great feature that lets you slice and dice the data you have in your spreadsheet. In Microsoft’s own words:
PivotTables are a great way to summarize, analyze, explore, and present your data, and you can create them with just a few clicks.
Microsoft has a great tutorial on how to create Pivot Tables in Excel (including a video) and a walkthrough tutorial is included in Excel itself. Google Sheets support pivot tables as well.
You may also want to take it one notch up and use Power Pivot add-on for Excel to do more powerful data analysis and create more elaborate data models.
SQL
If you have direct access to your data in a relational database you can use SQL (Structured Query Language) to retrieve the data already transformed for the needs of your data visualization. Learning the basics of SQL is relatively easy, but doing complex and efficient queries is not. There are lots of courses on SQL at places like LinkedIn Learning or Pluralsight (this one is actually free). There are also a lot of tutorials on the web and YouTube. This one seems to have good ratings and reviews:
In case you are more familiar with SQL than with spreadsheets, Google Sheets lets you use SQL to query the data in your spreasheet – something you can’t do with Excel out of the box (there are add-ins, though).
Changing Data Formats
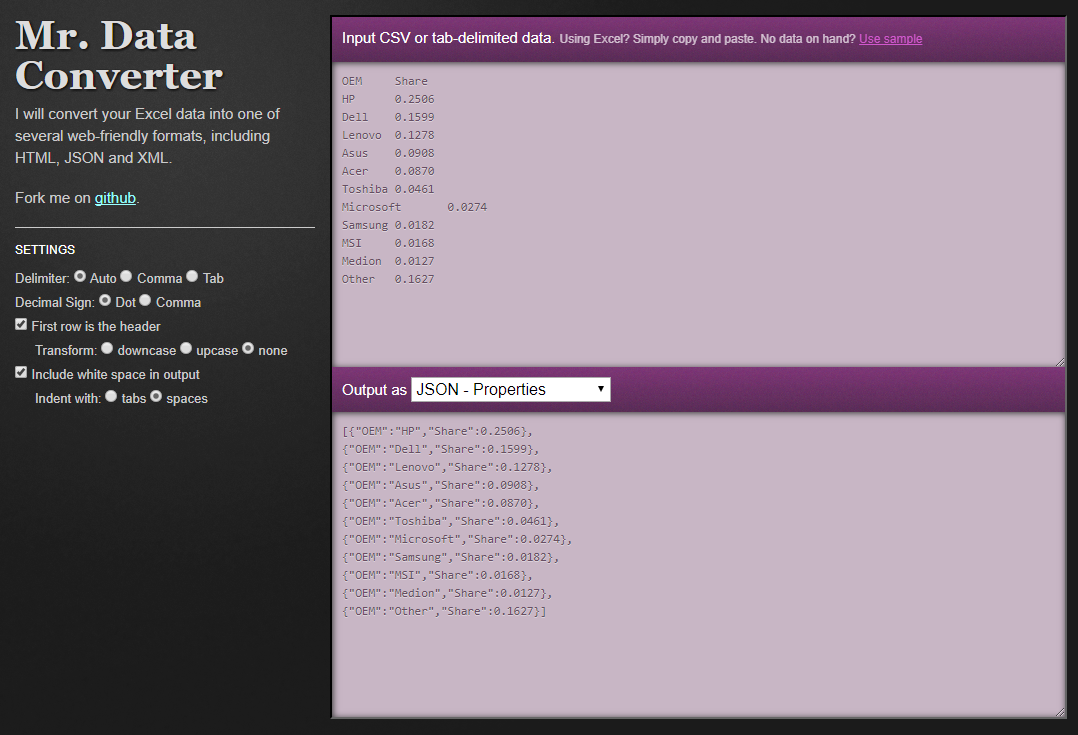 Spreadsheet software can transform your data, but it’s not always that you can feed XSLX files to your data visualization library. The most common format that web tools use these days, and the one we use in amCharts, is JSON. Luckily, there are tools that let you convert your spreadsheet or CSV data to JSON with ease. The one I like is called Mr. Data Converter and it lets you simply copy&paste the cells from Excel and get JSON right away.
We are giving away a great data visualization book each month! Subscribe to our newsletter to get monthly tips like the one above and you’ll be automatically entered in the sweepstakes to win an awesome book.