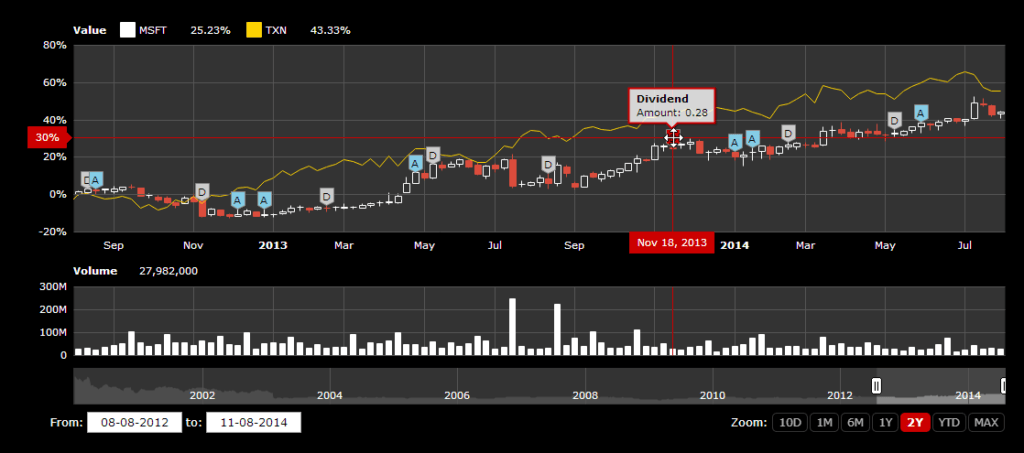
New advanced JavaScript Stock Chart features
We feel that among the exciting new 3D features introduced in the last version of JavaScript Charts there were lost a few other less stunning visually but equally as important new improvements. Here they are:
Crosshair cursors
Now you can specify the cursor to not only show a vertical line to the category axis, but also horizontal one to value axis of your choice, with (optionally) value balloon shown.
Use valueLineEnabled and valueLineBalloonEnabled properties to turn on this great analytic helper tool.
Professional candlesticks
Now you can enable an alternate behavior for candlesticks (proCandlesticks). If enabled, the candlestick fill logic will be applied based on the previous value. This is how it’s done in the professional stock charts.
Here’s a fully-featured realistic example showcasing both of the above.
