Version 3.14 Released – Our biggest update ever
We have just released a new version 3.14 (or PI as we called internally). And since π is the coolest number, it had to be the most exciting update to V3 product line ever.
If you’re eager to get the complete list of changes and updates, skip to the end of this post.
Otherwise, here are a few highlights we’re especially proud to point your attention to:
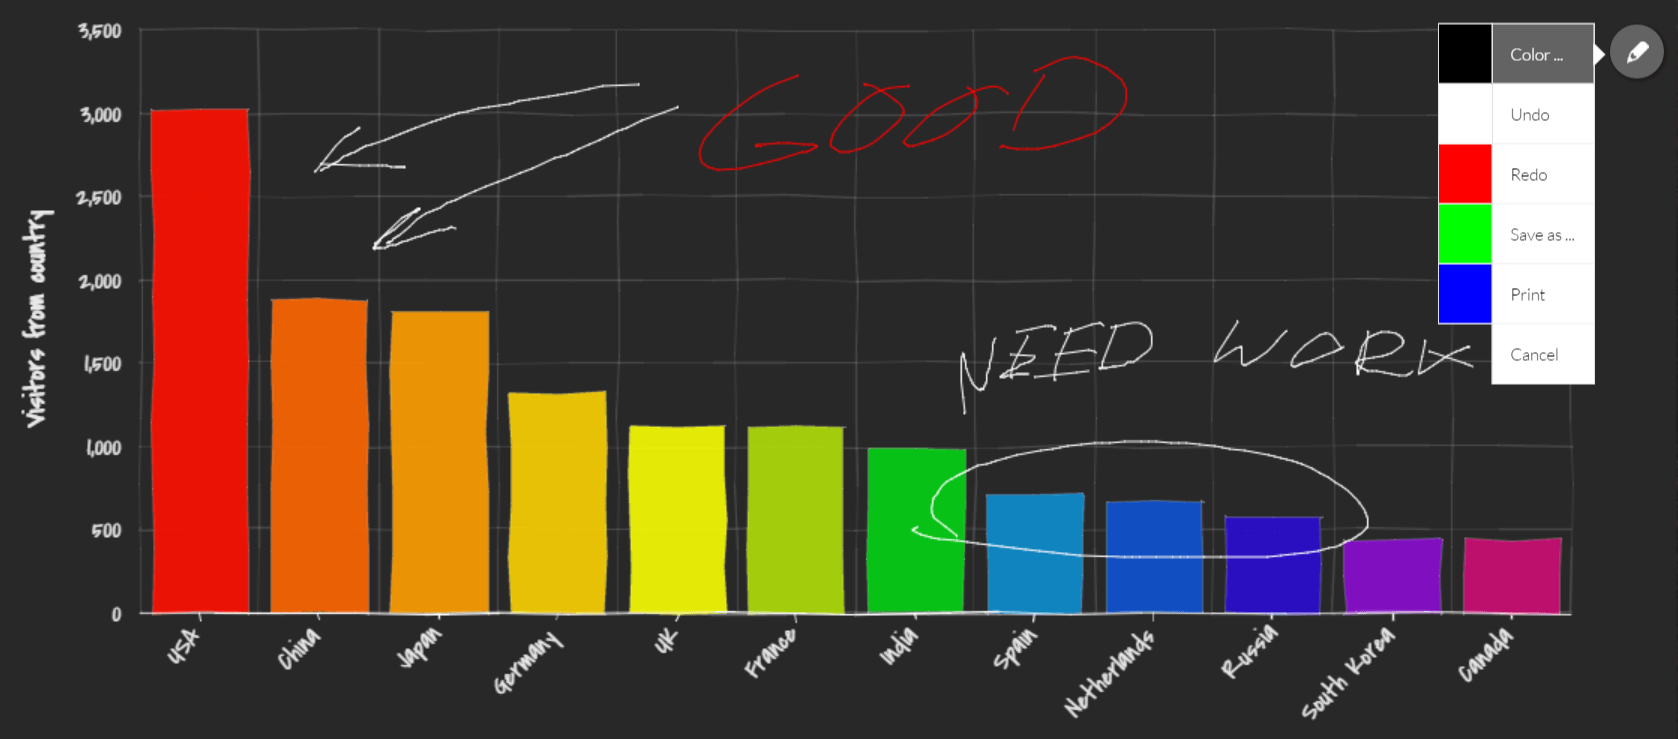
New export plugin
I mean we had chart export to images before. But now we have super-configurable, powerful and good looking plugin, that will not only export your images to JPG, PNG, SVG image formats, but will also save it as PDF, print it or even let you annotate or even execute your own JavaScript functions and do other cool stuff.
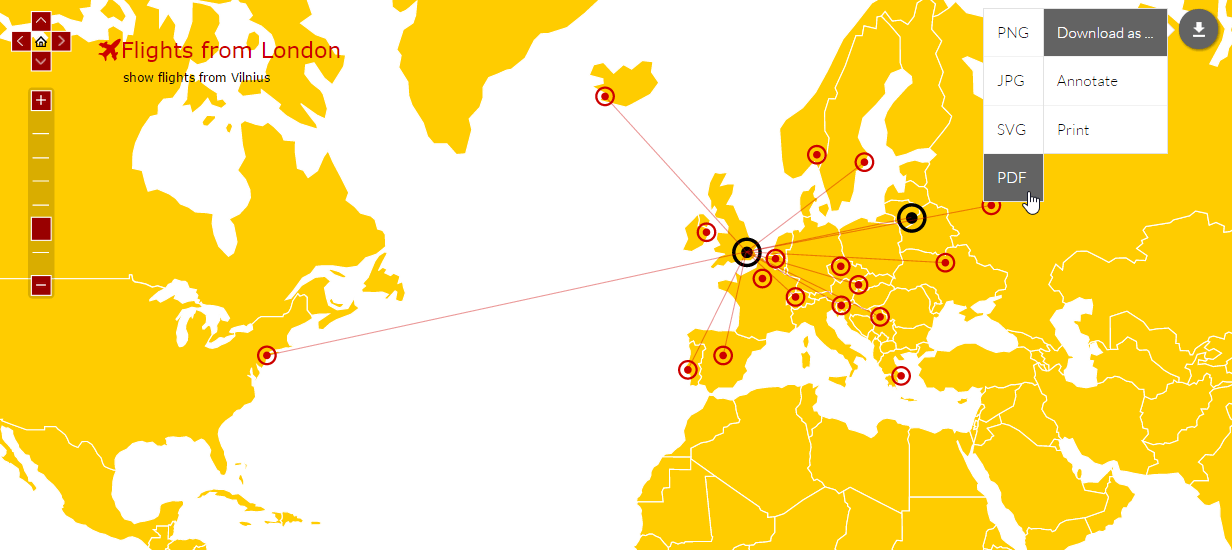
Find out more tricks on this tutorial page.
GANTT chart type
You can now create those multi-segmented bar charts that span time or value ranges.
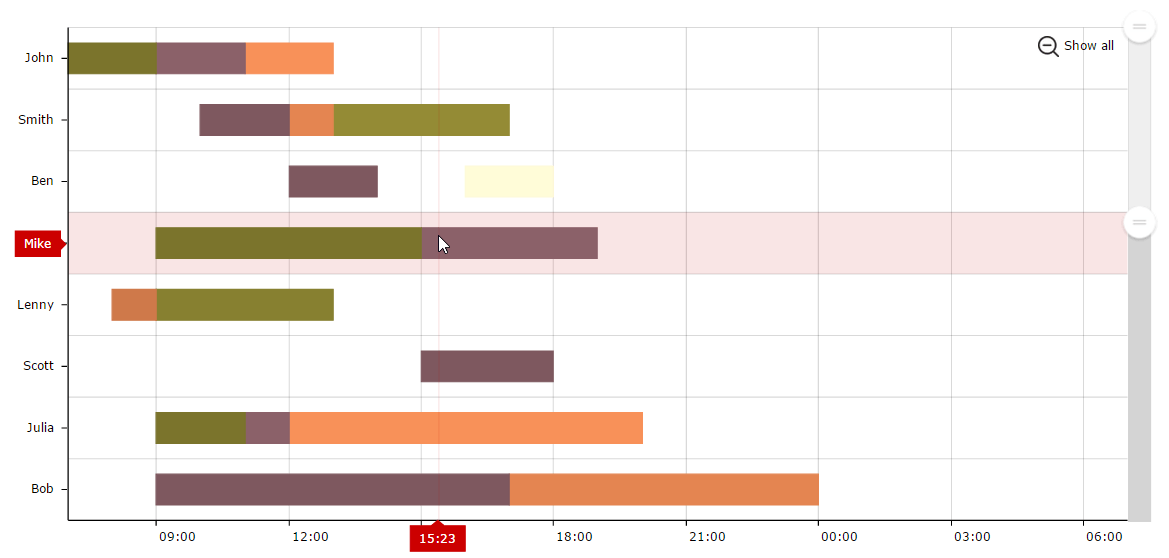
Here’s a live demo.
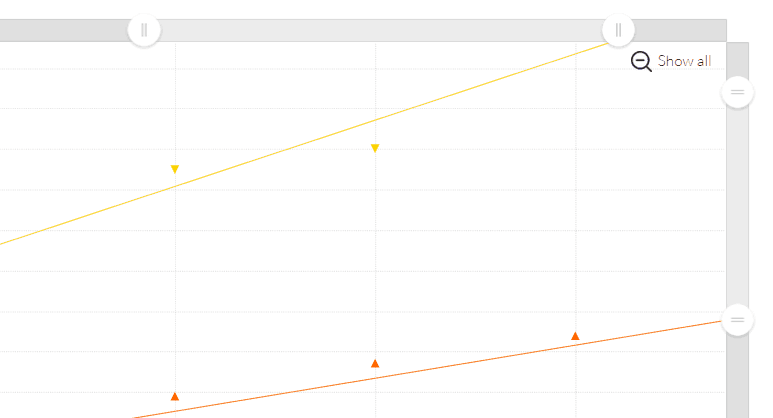
Better touch support
We’ve revamped all built-in controls for easier handling on touch devices.
The complete list of improvements
- New chart type: GANTT.
- Export as image completely rewritten. In addition to image formats it now supports exporting to PDF as well as saving data to JSON, XML or CSV. Annotation mode added, which enables free-draw annotations prior to exporting. Print function added.
- New icons such as resize grips, zoom-out lens, stock chart’s drawing icons – we made them bigger for better UX for touch screen users. You can find old icons in the amcharts/images/ folder if you prefer using them instead.
- Date-based value axis is now available. You can use it with both XY and Serial charts. Set “type” property of ValueAxis to “date”.
- minimumDate and maximumDate properties added to ValueAxis. These properties allow you to set min/max of valueAxis when axis type is “date”.
- strictMinMax property added to ValueAxis (default: false). If set to true it will follow minimum and maximum properties strictly.
- Chart now automatically adjusts it’s size when container size changes. You no longer need to call validateSize() method. This applies also if you show/hide div by setting display: none for chart div.
- dateFormat added to AmGraph. It is used in balloons if value axis is date-based.
- dateFormats property moved from CategoryAxis to AxisBase (as both axes now support date-based data).