Arc Diagrams
What is it?
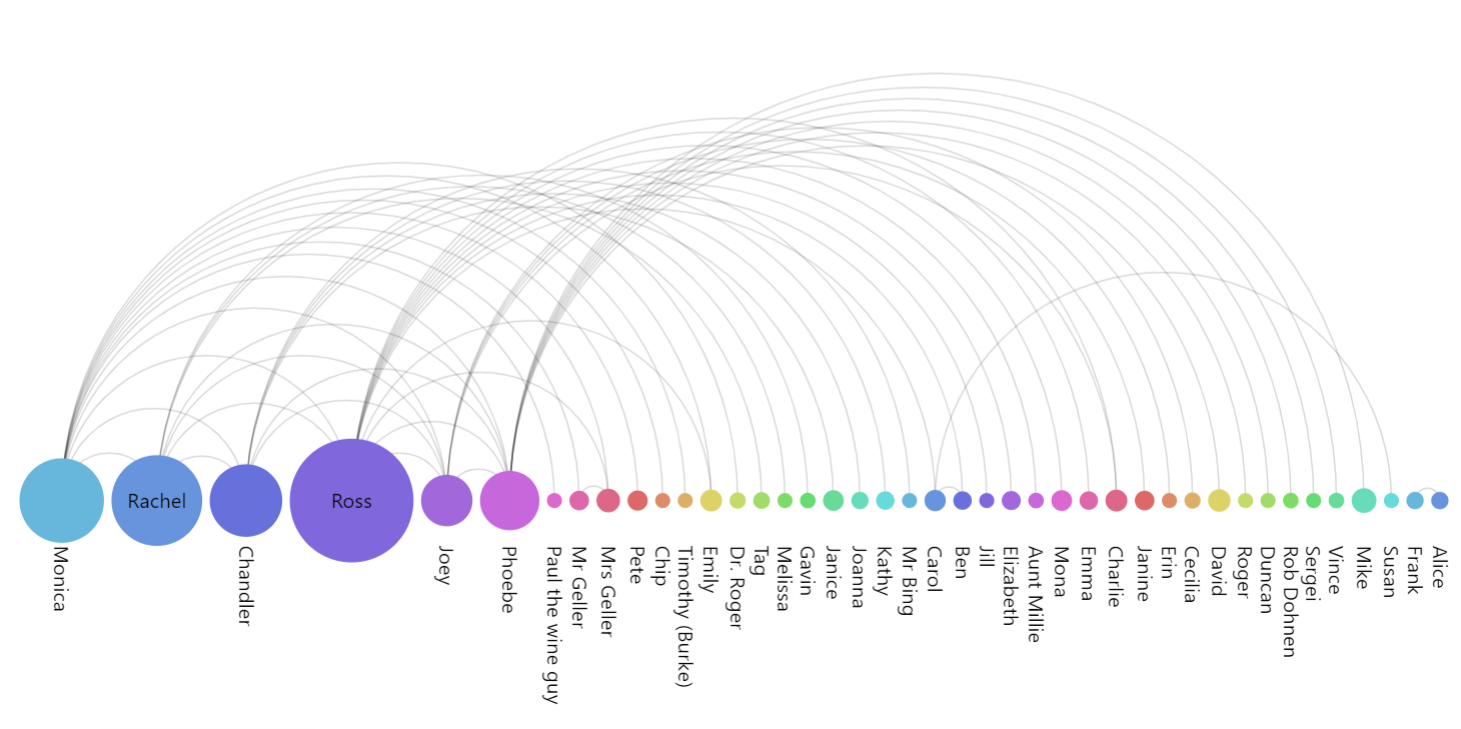
An arc diagram is a visualization technique that represents relationships or connections between entities. Typically used in graph theory and network analysis, an arc diagram displays nodes as points along a straight line or axis, with arcs or curves connecting pairs of nodes to represent relationships.
The bullets the arcs connect can vary in size to display their relative value. The arcs themselves can vary in thickness or color to convey additional information, making it a useful tool for illustrating complex networks and dependencies in a concise and visually intuitive manner.
amCharts implementation
amCharts 5: Charts fully supports Arc Diagrams – both horizontal (as in an example above) and vertical – as part of the Flow charts family.
Besides classic Arc Diagram features, there’s also built-in support for toggling of individual nodes.
Related documentation
Examples
Horizontal arc diagram
See the Pen Horizontal Arc Diagram by amCharts team (@amcharts) on CodePen.
Vertical arc diagram
See the Pen Vertical Arc Diagram by amCharts team (@amcharts) on CodePen.