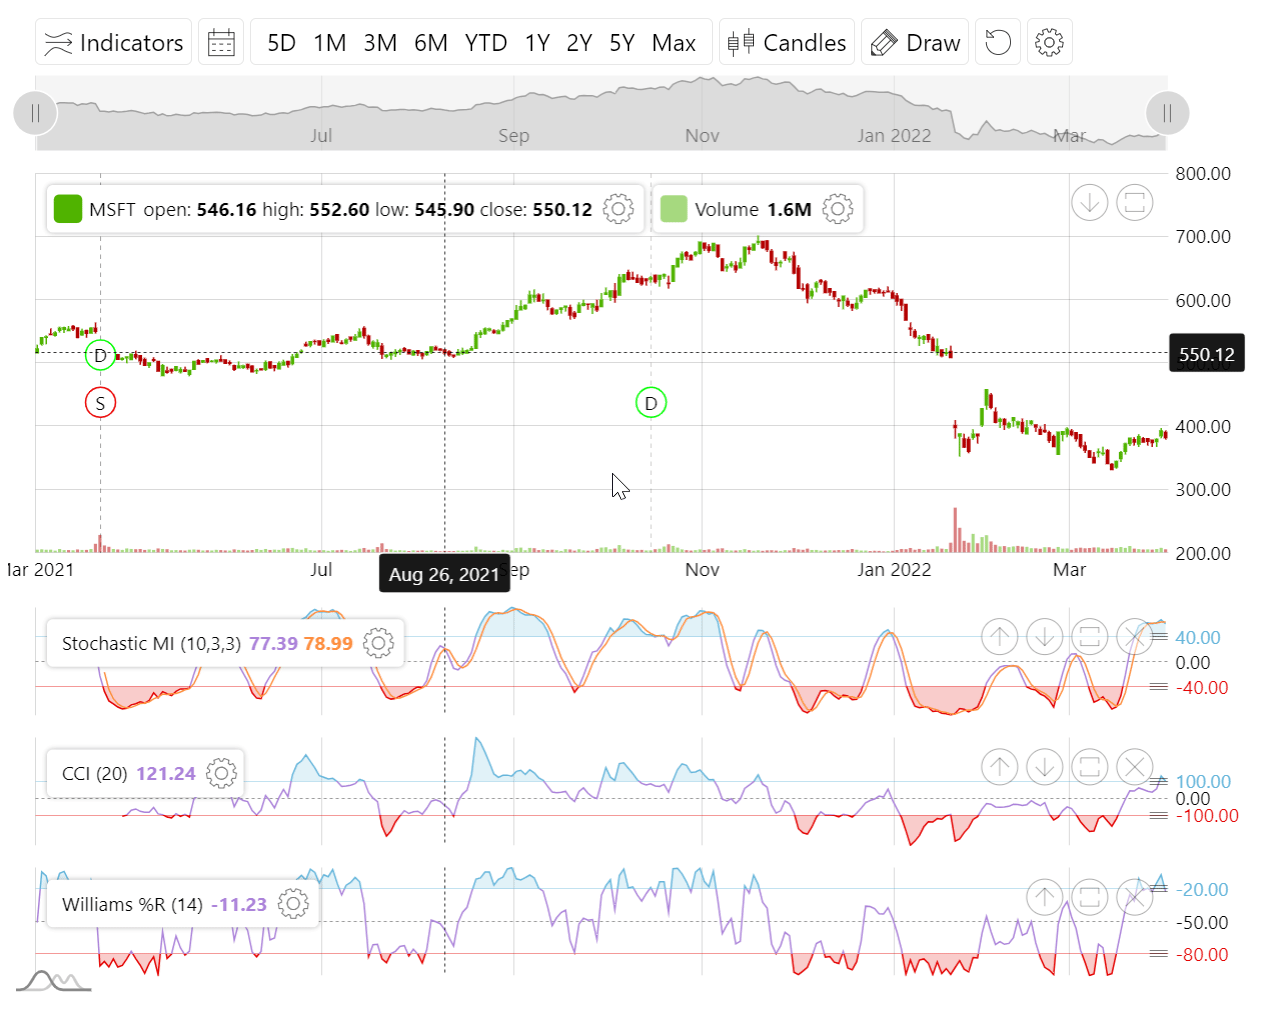
Draggable Oversold/Overbought Indicator Ranges
amCharts 5: Stock Chart comes bundled with a lot of technical indicators. Some of them use Oversold/Overbought range.
These are:
- Commodity Channel Index
- Relative Strength Index
- Stochastic Momentum Index
- Stochastic Oscillator
- Williams R
Starting from version 5.5.3 the Oversold and Overbought limits can be directly manipulated by dragging grip on the respective lines in the chart itself.
Demo
See the Pen Stock Chart with indicators by amCharts team (@amcharts) on CodePen.