Stochastic Momentum Index Indicator
What is it?
The Stochastic Momentum Index (SMI) represents an improved iteration of the standard stochastic oscillator, aimed at providing a more dependable indicator that reduces false signals by gauging the distance between the current closing price and the midpoint of the high/low price range. It was created by William Blau in 1993.
SMI oscillates within the range of -100% to 100% and is interpreted much like the Stochastics Oscillator. Crossing the 40% threshold on the SMI is typically viewed as a sign of overbought conditions, while dropping below -40% indicates oversold conditions.
Calculation
To perform this calculation, we begin by determining the highest and lowest values within a specific window, which is defined by the K Period parameter in the indicator settings. Subsequently, we calculate the relativeRange by subtracting the average of these highest and lowest values from the current closing price:
relativeRange = close - (highestHigh + lowestLow) / 2
After this we calculated double exponential moving average using D period parameter:
ds = EMA(EMA(relativeRange, D);
And double exponential moving average of the difference between highest and lowest values in the selected period:
dhl = EMA(EMA((highestHigh - lowestLow), D))
And finally we calculate SMI value:
smi = 200 * (ds / dhl)
Signal line is calculated applying EMA on the calculated smi value, using EMA period from settings:
signal = EMA(smi, EMA period);
amCharts implementation
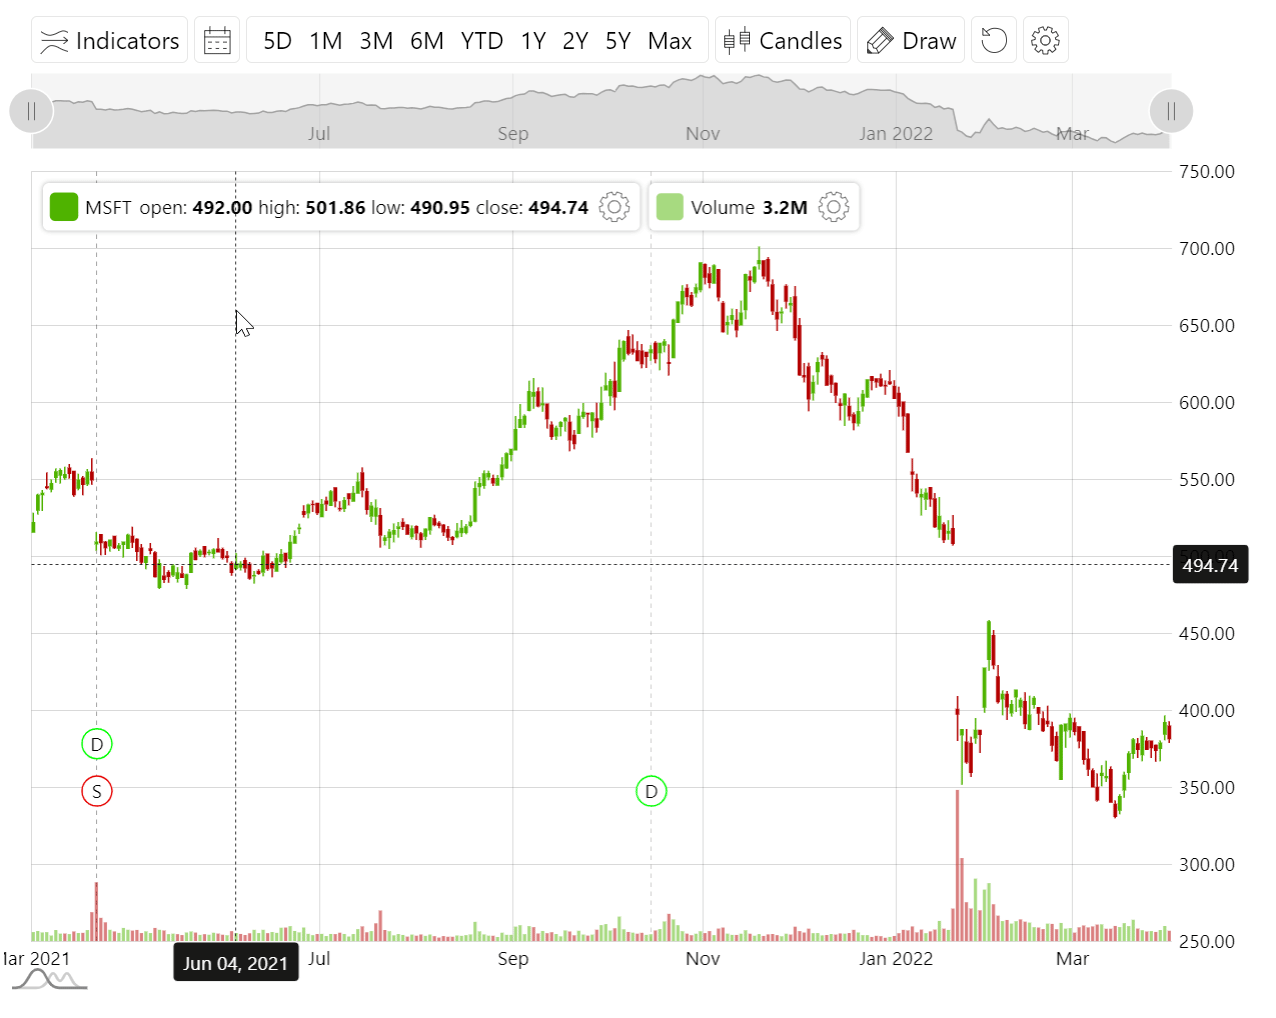
amCharts 5: Stock Chart has a built-in support for Stochastic Momentum Index Indicator since version 5.5.3.
It can be added via Indicator Control dropdown (docs) in Stock Chart’s toolbar.
It can also added via chart API code.
stockChart.indicators.push(am5stock.StochasticMomentumIndex.new(root, {
  stockChart: stockChart,
  stockSeries: valueSeries
}));
Demo
See the Pen Stock Chart with Stochastic Momentum Index Indicator by amCharts team (@amcharts) on CodePen.