Voronoi Treemap
What is it?
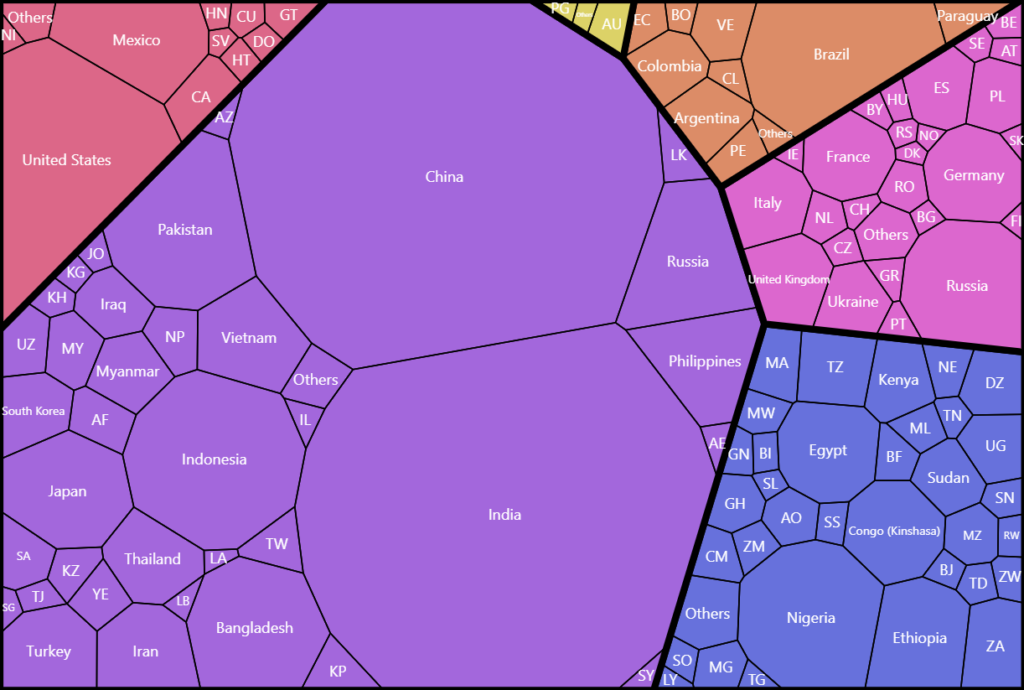
A Voronoi treemap is a data visualization technique used to represent hierarchical or categorized information in a structured and space-filling manner.
It partitions a defined area into cells that are based on the Voronoi diagram, which allocates space to each category or element in a way that minimizes the distance to its associated data points. The result is a treemap where the size and shape of each cell correspond to the value or hierarchy of the represented data, allowing for efficient and aesthetically pleasing visualization of complex datasets.
Voronoi treemaps are particularly useful for displaying hierarchical data, such as file systems, organizational structures, or market segmentation, as they provide a clear and intuitive way to understand the relationships and proportions of data categories within a given space.
amCharts implementation
amCharts has full support for Voronoi Treemaps – both square and circular.
Documentation:
Demos:
Example
See the Pen Drill-down Voronoi Treemap by amCharts team (@amcharts) on CodePen.