Improve user experience and performance with dynamic data grouping in amCharts 4.7
The just-released amCharts 4.7.0 introduces a very attractive and important way of automatically grouping data values. We call it dynamic data item grouping and you can read all the details about it in the documentation here.
Where is dynamic data grouping useful?
Suppose you have 10 years’ worth of daily data to plot. That’s about 3.6K data items right there.
Plotting all of those thousands of data points on a chart that’s, say, 1000 pixels wide is not only useless (user would not be able to see all those points) but also poses a performance
The dynamic grouping feature tackles this issue by automatically grouping data items into larger periods, using some configurable aggregate value.
Where can I see it in action?
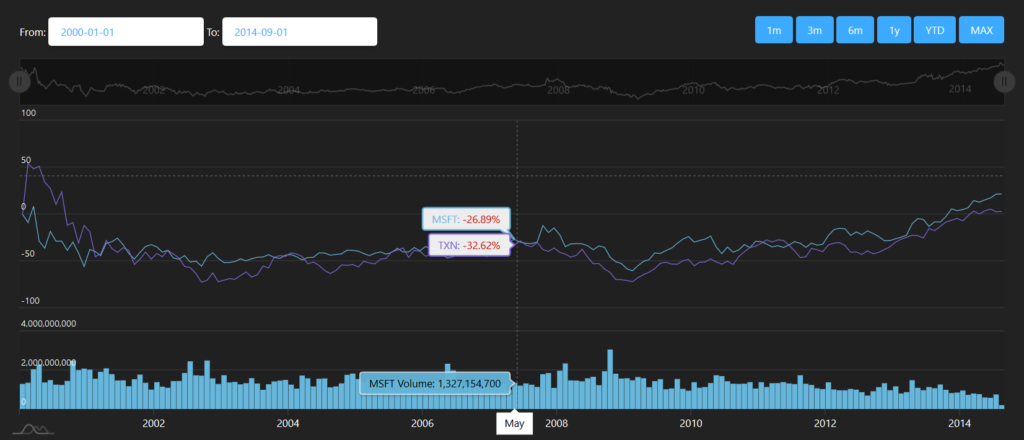
Check out this stock chart demo that uses dynamic item grouping to create a stock chart that would require a specialized stock charting library previously. In addition to dynamic data item
That’s great! How do I start using dynamic data item grouping?
- Make sure that you have amCharts 4.7.0 or newer.
- Read the documentation for the data grouping feature and check out the code in the demo.
- Apply your newfound knowledge in your creations!