Responsive Layout Control with amCharts 4.2

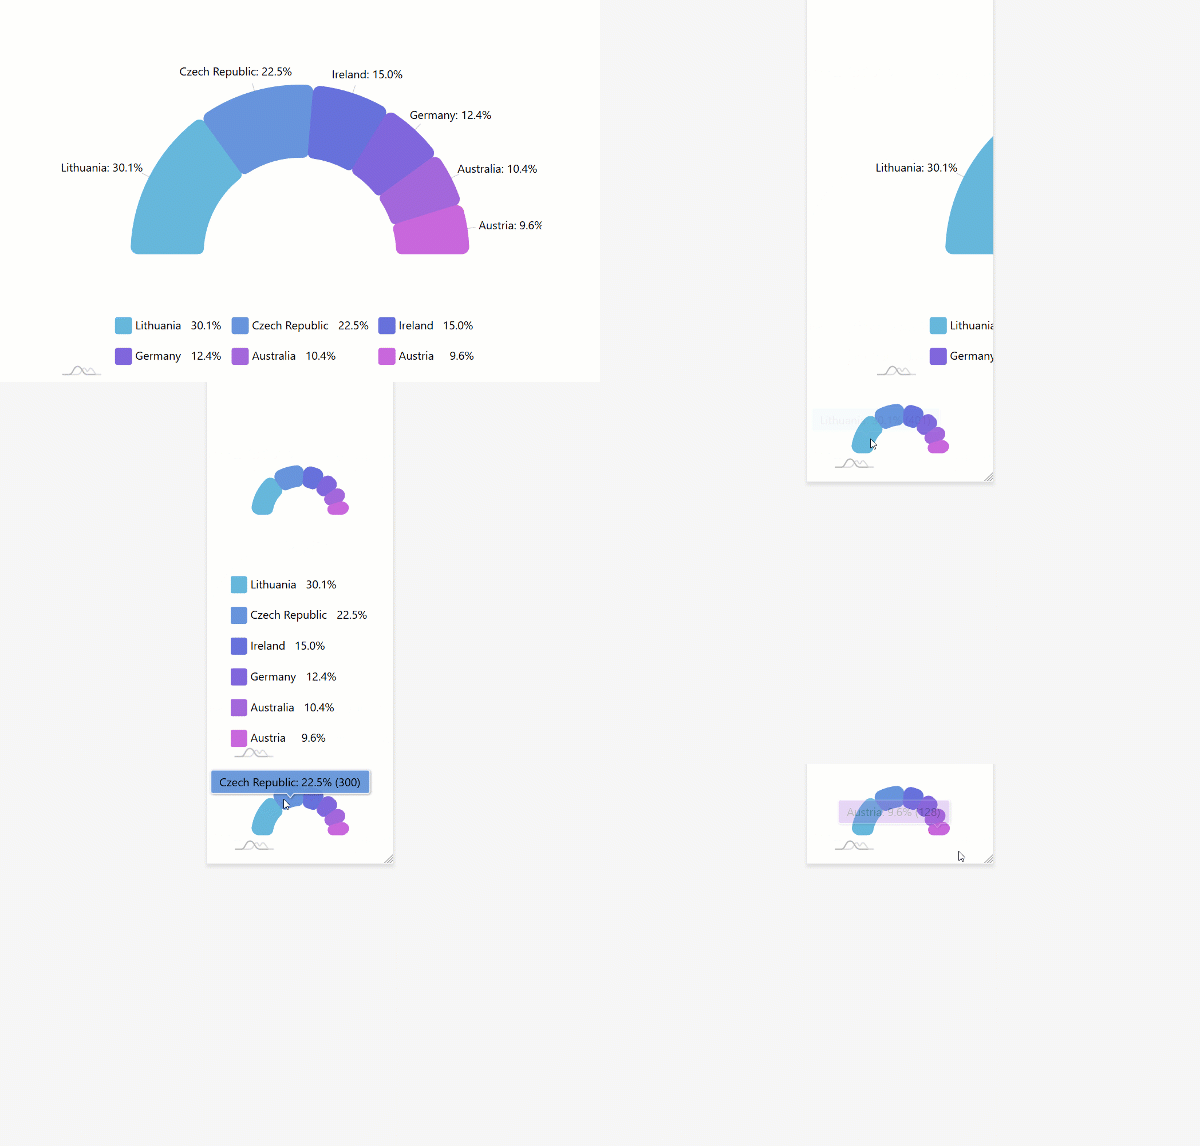
Today we have released amCharts 4.2 which, among other things, includes new responsive layout features. Read all about responsive layout in amCharts 4 in this document.
Another highly requested feature is the ability to export multiple charts at once.
Get the latest amCharts version now.
Complete Changelog for versions 4.1.11 – 4.2.0
Added
- Added
read-only propertyof CategoryAxis: frequency. Indicates every X label is shown. - Added JSON example of
Candle stickjson /candlestick-series). New Exportproperty : extraSprites. May contain a list of references to otherSprites(e.g. external legend or evenother chart ) to attach toexported image. More info.- Experimental responsive features and default rules are now active. More info.
New Tooltipproprety keepTargetHover– will make target element hovered as long as its tooltipis hovered , good for bullets and map images.New Tooltipproprety targetSprite– containsreference to element this tooltip is displayedfor, if any.New PictorialStackedSeriesproperties :startLocationandendLocation– allow setting relative start and end positions of the shape to fill.- New
FunnelSeries/PyramidSeries/PictorialStackedSeriesproperty:labelsOpposite– allows controlling which side of the series to show labelswhen alignLabels = true.
Changed
- Accessibility: Default role of the Legend’s item containers was changed to “switch”.
- Hiding or showing an element will now automatically set
its readerHiddenattribute accordingly. On MapPolygondefault valueof nonScalingStrokeis now set totrue(asfalse).- When calculating font size for a word on a
WordCloudchart it now uses smaller side of the series area instead of height. Tooltip‘s label paddingBottomdefault value changedfrom 6to 4pixels for better centering of text.Default valueof minFontSizein WordCloudSeriesto 2%. Default valueof maxFontSizein WordCloudSeriesto 20%. - Label sizing algorithm updated
in WordCloudSeries.
Fixed
- Accessibility: Legend’s containers when toggling items were setting
value of aria-checkedincorrectly . - JSON:
Using childrenwith an array value was duplicating elements.
Working around a bug with Angular’s dead code eliminationin --prodmode . Fixed ValueAxisissue with animation when there’s onlysingle data item.- Sometimes axis ticks on a chart with a lot of data/series were not positioned properly.
Sometimes baseInterval = "year"on aDateAxiscould causestack overflow.