New massive update V3.18 brings a slew of exciting features
After record-breaking nearly two months in the making, version 3.18 is finally out!
The main features of this release are dramatic performance enhancements, zoomable/scrollable value axes, pinch-to-zoom gesture support on serial charts, smoother animations, radial gradients in pie charts, and the whole new drop-shaped balloon option.
Head over to our Download section to grab the latest files.
Here’s the full list of changes:
- valueScrollbar added to SerialChart. Adds ChartScrollbar to ValueAxis. You can set autoGridCount to true to enable axis labels. This trick can also be used by XY chart (albeit by using regular chartScrollbar property, not valueScrollbar). Here is a demo of serial chart with value scrollbar.
- valueZoomable property added to ChartCursor (default: false). If set to true, makes the cursor zoom value axis(es) as well. Works best if valueScrollbar is added to a chart. Here is a GANTT chart with zoomable value axis.
- You can now pan XY chart with chart cursor (previously it was only possible to select area for zoom-in). To enable this feature, set pan property of ChartCursor to true. To enable pan of value axis on Serial chart, set valueZoomable of ChartCursor to true. XY Chart with pan enabled demo.
- maxZoomFactor is now property of AmRectangularChart, with default value 20. Specifies max zoom factor of ValueAxis.
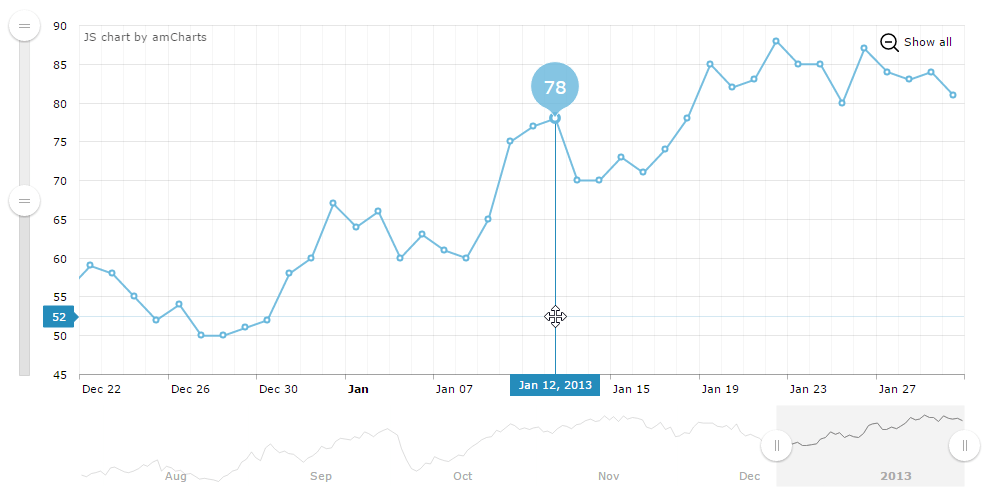
- drop property (default: false) added to AmBalloon (not supported by IE8). Allows having drop-shaped balloons. Note, these balloons will not check for overlapping with other balloons, or if they go outside plot area. It also does not change pointer orientation automatically based on its vertical position like regular balloons do. You can use pointerOrientation property if you want it to point to different direction. Demo of a chart using this kind of balloon.
- pointerOrientation property added to AmBalloon, with default value down and other possible values left, top, right, bottom. Works only if balloon.drop set to true.
- zoomOutValueAxes() method added To AmRectangularChart. When invoked, it zooms-out value axes.
- gradientType added to AmPieChart. The default is now at “radial”. (previously chart supported only linear gradients) It makes a lot more sense to have radial gradients on pie chart. Note, IE8 does not support this. Here is pie chart with gradient fill example.
- minValue and maxValue properties added to AmXYChart. These can be used to adjust size/scale of bubbles. If these properties are not set, the bubble with smallest value will be of minBulletSize and bubble with biggest value will be of maxBulletSize. However, you might want bubble size to change relative to 0 or some other value. In this case you can use minValue and maxValue properties. Note, if you use these two settings, you might also want to set minBulletSize to 0.
- balloonText property added to TrendLine. When set, enables displaying a roll-over balloon.
- onShowCursor, zoomStarted, panning events added to ChartCursor.
- limitToGraph property added to ChartCursor. If set to an id or a reference to AmGraph object, CategoryAxis cursor line will be limited to this graph instead of being drawn through full height of plot area. Note, this works with serial chart only. Also, cursorPosition of ChartCursor must be set to middle.
- syncWithCursor(cursor) method added to ChartCursor. Allows to sync one serial chart’s cursor with another chart’s cursor.
- balloon property added to AmGraph and AxisBase. Allows customizing axes and graphs balloons individually (only when ChartCursoris used). Note: the balloon object is not created automatically, you should create it before setting properties, for example: graph.balloon = {drop:true} and not graph.balloon.drop = true.
- valueLineBalloonEnabled now adds value balloons to all available value axes (both Serial and XY chart).
- animationFinished event added to AmChart. It is dispatched when graphs or slices finish animating.
- zoomOutAxes property added to PanelsSettings (default: true. Specifies if zoomed-in value axes should be zoomed-out when user changes selected period with PeriodSelector.
- processTimeout property added to AmChart and AmStockChart (default: 0). If you set it to 1 or some bigger value, chart will be built in chunks instead of all at once. This is useful if you work with a lot of data and the initial build of the chart takes a lot of time, which freezes the whole web application by not allowing other processes to do their job while the chart is busy.
- Serial chart now has property processCount (default 1000). If processTimeout is > 0, 1000 data items will be parsed at a time, then the chart will make pause and continue parsing data until it finishes.
- buildStarted event added to AmChartand AmStockChart. Fired just before the chart starts to build itself for the first time. Note: you might need to set processTimeout to > 0 value in order to register this event properly.
- You can set categoryAxisDateFormat of ChartCursor to undefined now. If set cursor’s category axis balloon will use current date format of category axis.
- Bug fix: chart cursor was not working properly on mekko chart (variable column width chart).
- Bug fix: addressed pan freezing issues introduced in Chrome v47.
- Bug fix: Microsoft Edge was ignoring touch-move events.
- Bug fix: stacked areas on date-based chart could start on wrong place after graph was hidden.
- Bug fix: AmAngularGauge was broken if legend was added.
- Bug fix: showNextAvailable property of ChartCursor was ignored by legend.
- Bug fix: Pyramid chart did not display the tip of the pyramid in some cases.
- Bug fix: init event was not fired by AmAngularGauge.
- Bug fix: sometimes init, rendered and draw events were fired too early, before the chart was actually drawn.
- Bug fix: mouse wheel zoom was not working on IE8.
- Bug fix: if autoSize of AmChart was set to false, mouse position was not properly detected after page was scrolled.
- Bug fix: selectFromStart property of PeriodSelector was not working properly with period button which used YYYY period.
- Bug fix: it was impossible to delete guides which were added via chart config (using eraser tool of Stock chart).
- Bug fix: string-based dates in guides were not being parsed properly if they contained only numbers.