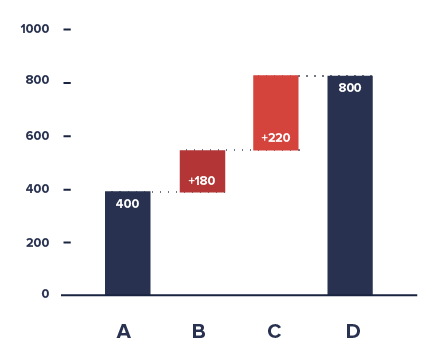
Waterfall chart is a special kind of chart consisting of floating columns that relate each other via their open and close values.
This tutorial will explain how you can build one with amCharts 4 by combining Column and Step line series on an XY chart.
Prerequisites
This tutorial relies experience creating XY charts and its series. If you haven't done so already, we recommend you read "Anatomy of an XY Chart".
The data
Since we are going to display floating columns, we'll need our data to have fields for open and end value.
We're also going to have separate fields for values of connecting fields. We'll explain why we need separate values for those later.
Finally, we'll have color for each separate column.
Here's a sample data:
[{
  category: "Net revenue",
  value: 8786,
  open: 0,
  stepValue: 8786,
  color: am4core.color("#c3dc67")
}, {
  category: "Cost of sales",
  value: 8786 - 2786,
  open: 8786,
  stepValue: 8786 - 2786,
  color: am4core.color("#dc6788")
}, {
  category: "Operating expenses",
  value: 8786 - 2786 - 1786,
  open: 8786 - 2786,
  stepValue: 8786 - 2786 - 1786,
  color: am4core.color("#dc6967")
}, {
  category: "Amortisation",
  value: 8786 - 2786 - 1786 - 453,
  open: 8786 - 2786 - 1786,
  stepValue: 8786 - 2786 - 1786 - 453,
  color: am4core.color("#dc8c67")
}, {
  category: "Income from equity",
  value: 8786 - 2786 - 1786 - 453 + 1465,
  open: 8786 - 2786 - 1786 - 453,
  stepValue: 8786 - 2786 - 1786 - 453 + 1465,
  color: am4core.color("#67dc75")
}, {
  category: "Operating income",
  value: 8786 - 2786 - 1786 - 453 + 1465,
  open: 0,
  color: am4core.color("#67dc98")
}]
Don't be alarmed by the mathematics going on in data. We're using those instead of absolute values to illustrate how Waterfall charts work, and how position/value of each column depends on the value of the previous one.
Creating floating columns
We are going to be using a regular ColumnSeries to display our columns.
Besides regular data fields like "categoryX" and "valueY", we're also going to be using "openValueY", which indicates "open" value. If open value is set, the column will not start at zero, but rather at that value.
let columnSeries = chart.series.push(new am4charts.ColumnSeries());
columnSeries.dataFields.categoryX = "category";
columnSeries.dataFields.valueY = "value";
columnSeries.dataFields.openValueY = "open";
var columnSeries = chart.series.push(new am4charts.ColumnSeries());
columnSeries.dataFields.categoryX = "category";
columnSeries.dataFields.valueY = "value";
columnSeries.dataFields.openValueY = "open";
{
  // ...
  "series": [{
    "type": "ColumnSeries",
    "dataFields": {
      "categoryX": "category",
      "valueY": "value",
      "openValueY": "open"
    }
  }]
}
We also have custom colors set in data for each data point, so we are going to use column template's propertyFills to use that data for its fill property:
let columnTemplate = columnSeries.columns.template;
columnTemplate.strokeOpacity = 0;
columnTemplate.propertyFields.fill = "color";
var columnTemplate = columnSeries.columns.template;
columnTemplate.strokeOpacity = 0;
columnTemplate.propertyFields.fill = "color";
{
  // ...
  "series": [{
    "type": "ColumnSeries",
    // ...
    "columns": {
      "strokeOpacity": 0,
      "propertyFields": {
        "fill": "color"
      }
    }
  }]
}
MORE INFO Learn more about property fields.
Let's see what we have so far:
See the Pen amCharts 4: Waterfall chart (1) by amCharts (@amcharts) on CodePen.
Adding auto-calculated labels
We also want to indicate the actual values of the columns.
Normally, we'd just plop a label inside columns' template that displays column's value. That won't work in this case, because we only have start (open) and end (close) values of the column. The actual real value is difference between the two.
To display a label, we'll need to create an adapter that will dynamically calculate that difference as well as format our value.
MORE INFO Not sure what "adapter" is? Read about "Adapters".
let label = columnTemplate.createChild(am4core.Label);
label.align = "center";
label.valign = "middle";
label.adapter.add("text", function(text, target) {
  if (!target.dataItem) {
    return text;
  }
  let value = Math.abs(target.dataItem.dataContext.value - target.dataItem.dataContext.open);
  return target.numberFormatter.format(value, "$#,## a");
});
var label = columnTemplate.createChild(am4core.Label);
label.align = "center";
label.valign = "middle";
label.adapter.add("text", function(text, target) {
  if (!target.dataItem) {
    return text;
  }
  var value = Math.abs(target.dataItem.dataContext.value - target.dataItem.dataContext.open);
  return target.numberFormatter.format(value, "$#,## a");
});
{
  // ...
  "series": [{
    "type": "ColumnSeries",
    // ...
    "columns": {
      // ...
      "children": [{
        "type": "Label",
        "align": "center",
        "valign": "middle",
        "adapter": {
          "text": function(text, target) {
            if (!target.dataItem) {
              return text;
            }
            var value = Math.abs(target.dataItem.dataContext.value - target.dataItem.dataContext.open);
            return target.numberFormatter.format(value, "$#,## a");
          }
        }
      }]
    }
  }]
}
As you can see, we've added a custom function (adapter) to be responsible for the content of the Label we added into our column template.
The function pulls data from the target and calculates the difference between open and close values, then uses own Number formatter to format it.
MORE INFO Learn more about formatting numbers.
Let's see how it turned out:
See the Pen amCharts 4: Waterfall chart (2) by amCharts (@amcharts) on CodePen.
Creating connecting lines
We have left one final touch to complete our waterfall chart - connecting horizontal lines.
We're going to use a StepLineSeries for that.
A Step line series displays a line graph consisting only of horizontal ant vertical lines, connecting each adjacent data items using steps, hence the name.
It also has a noRisers option, which disables vertical connection part, leaving us with just horizontal ones.
We're also going to make it dashed.
This is a prefect time to explain why we needed separate fields in data for the Step line series. The reason is simple: we have six columns, but only five lines connecting them. If we used the same values for Step line series, we'd end up with six connecting lines, while we don't need the last one.
let stepSeries = chart.series.push(new am4charts.StepLineSeries());
stepSeries.dataFields.categoryX = "category";
stepSeries.dataFields.valueY = "stepValue";
stepSeries.noRisers = true;
stepSeries.stroke = am4core.color("#000");
stepSeries.strokeDasharray = "3,3";
var stepSeries = chart.series.push(new am4charts.StepLineSeries());
stepSeries.dataFields.categoryX = "category";
stepSeries.dataFields.valueY = "stepValue";
stepSeries.noRisers = true;
stepSeries.stroke = am4core.color("#000");
stepSeries.strokeDasharray = "3,3";
{
  // ...
  "series": [{
    "type": "ColumnSeries",
    // ...
  }, {
    "type": "StepLineSeries",
    "noRisers": true,
    "stroke": "#000",
    "strokeDasharray": "3,3",
    "dataFields": {
      "categoryX": "category",
      "valueY": "steValue"
    }
  }]
}
Let's try running it now:
See the Pen amCharts 4: Waterfall chart (3) by amCharts (@amcharts) on CodePen.
OK, the lines are there, but they are centered and do not look good. Definitely, not what we wanted. Let's fix that.
Normally, Step series' horizontal line will span the whole width of the category (horizontal axis cell). However, columns, span only 80% of it, hence both of the chart components not aligning well.
We'll need to instruct Step series lines to start at 10% of the cell, and end at 10% of the next cell, so it connects with the column in it.
For that, Step series has two properties: startLocation and endLocation. Those are relative values, indicating where within category (cell) line should start and end, respectively.
The values are relative, 0 (zero) indicating start of the cell, 0.5 - middle, 1 (one) end, and so on.
So, if we want our step lines to start at 10% of the category, we'll have to set startLocation = 0.1. If we want it to end at 10% of the next category (cell), we'll need to instruct it to end at 110%, or endLocation = 1.1.
stepSeries.startLocation = 0.1;
stepSeries.endLocation = 1.1;
stepSeries.startLocation = 0.1;
stepSeries.endLocation = 1.1;
{
  // ...
  "series": [{
    "type": "ColumnSeries",
    // ...
  }, {
    "type": "StepLineSeries",
    // ...
    "startLocation": 0.1,
    "endLocation": 1.1
  }]
}
Let's check it now:
See the Pen amCharts 4: Waterfall chart (4) by amCharts (@amcharts) on CodePen.
Perfect!