amCharts 4 comes with extensive accessibility functionality, of which part is ability to highlight focused items with a high-contrast outline. This tutorial will show how you can modify the appearance of this outline.
Default behavior
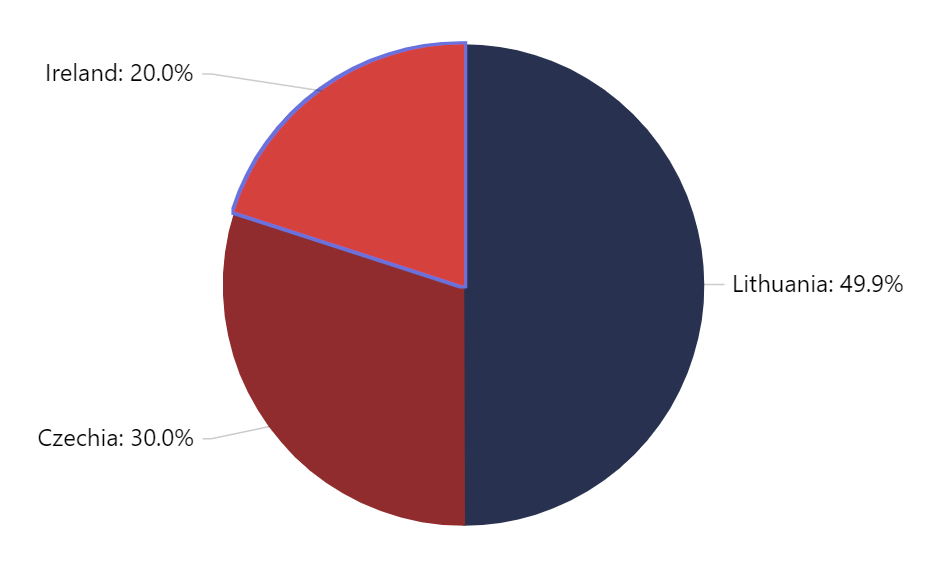
Some chart elements - columns, buttons, bullets, or slices to name a few - are selectable via TAB key.
When an element is focused in such way, a bluish outline is shown around such element.
Let's see how it works.
How it works
When a focusable element gains focus, the chart applies a FocusFilter to it.
A filter is a way to manipulate appearance of the element by applying certain set of rules to it.
MORE INFO For more information about filters and how they work, read here.
When chart is created, an instance of FocusFilter is created and placed in chart's focusFilter property.
This is an instance of that filter that gets applied to it.
Modifying focus appearance
We now know that outline is determined by a single FocusFilter instance. To modify how it looks, we can modify its properties.
Suppose we'd like to change its builsh color to green, and make it thicker:
chart.focusFilter.stroke = am4core.color("#0f0");
chart.focusFilter.strokeWidth = 5;
chart.focusFilter.stroke = am4core.color("#0f0");
chart.focusFilter.strokeWidth = 5;
{
  // ...
  "focusFilter": {
    "stroke": "#0f0",
    "strokeWidth": 5
  }
}
And there we go:

Example
See the Pen amCharts 4: Modifying focus appearance by amCharts team (@amcharts) on CodePen.
Disabling custom outline
amCharts uses custom outline filter which highlights edges of the focused element.
Should we want to disable this behavior and go with the default square highlighter, we can simply unset chart's focusFilter:
chart.focusFilter = undefined;
chart.focusFilter = undefined;
{
  // ...
  "focusFilter": undefined
}