This tutorial will explain how individual column labels (bullets) can be used as Category axis labels.
The task
During the course of this tutorial, we are going to give a fairly basic clustered column chart a makeup.
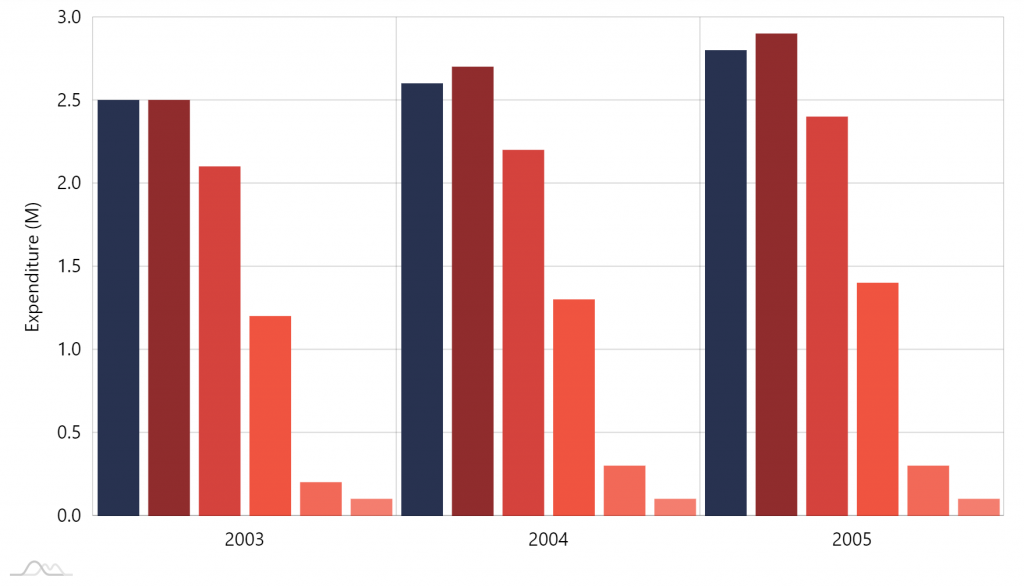
Starting point 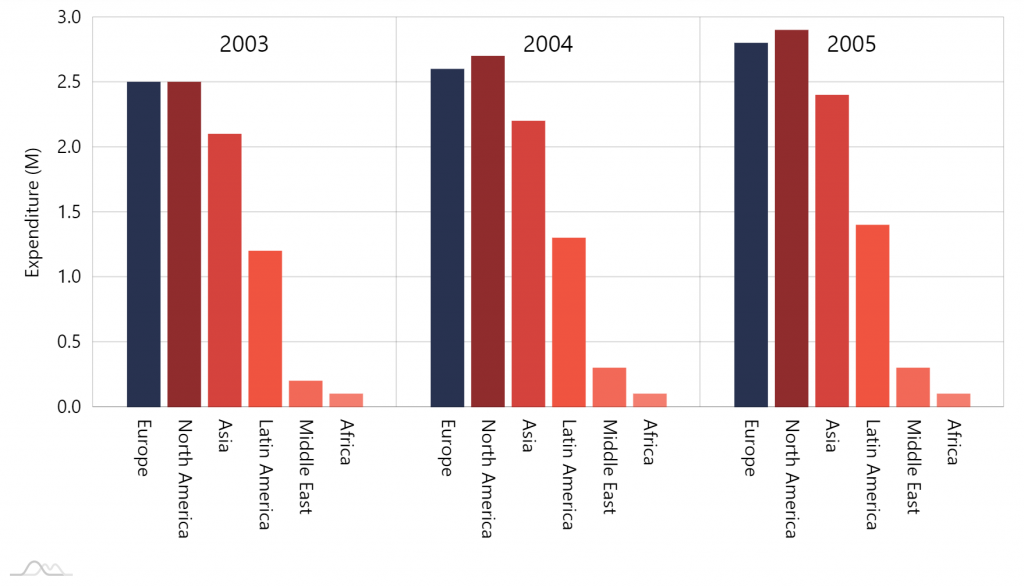
Target
Let's do this step by step.
Moving categories up
First task is to move those year categories up top.
To do so, we need to first put category labels inside the plot area as well as align them to top. While we're at it, let's also make them larger.
categoryAxis.renderer.inside = true;
categoryAxis.renderer.labels.template.valign = "top";
categoryAxis.renderer.labels.template.fontSize = 20;
categoryAxis.renderer.inside = true;
categoryAxis.renderer.labels.template.valign = "top";
categoryAxis.renderer.labels.template.fontSize = 20;
{
  // …
  "xAxes": [{
    // …
    "renderer": {
      "inside": true,
      "labels": {
        "valign" : "top",
        "fontSize": 20
      }
    }
  }]
}
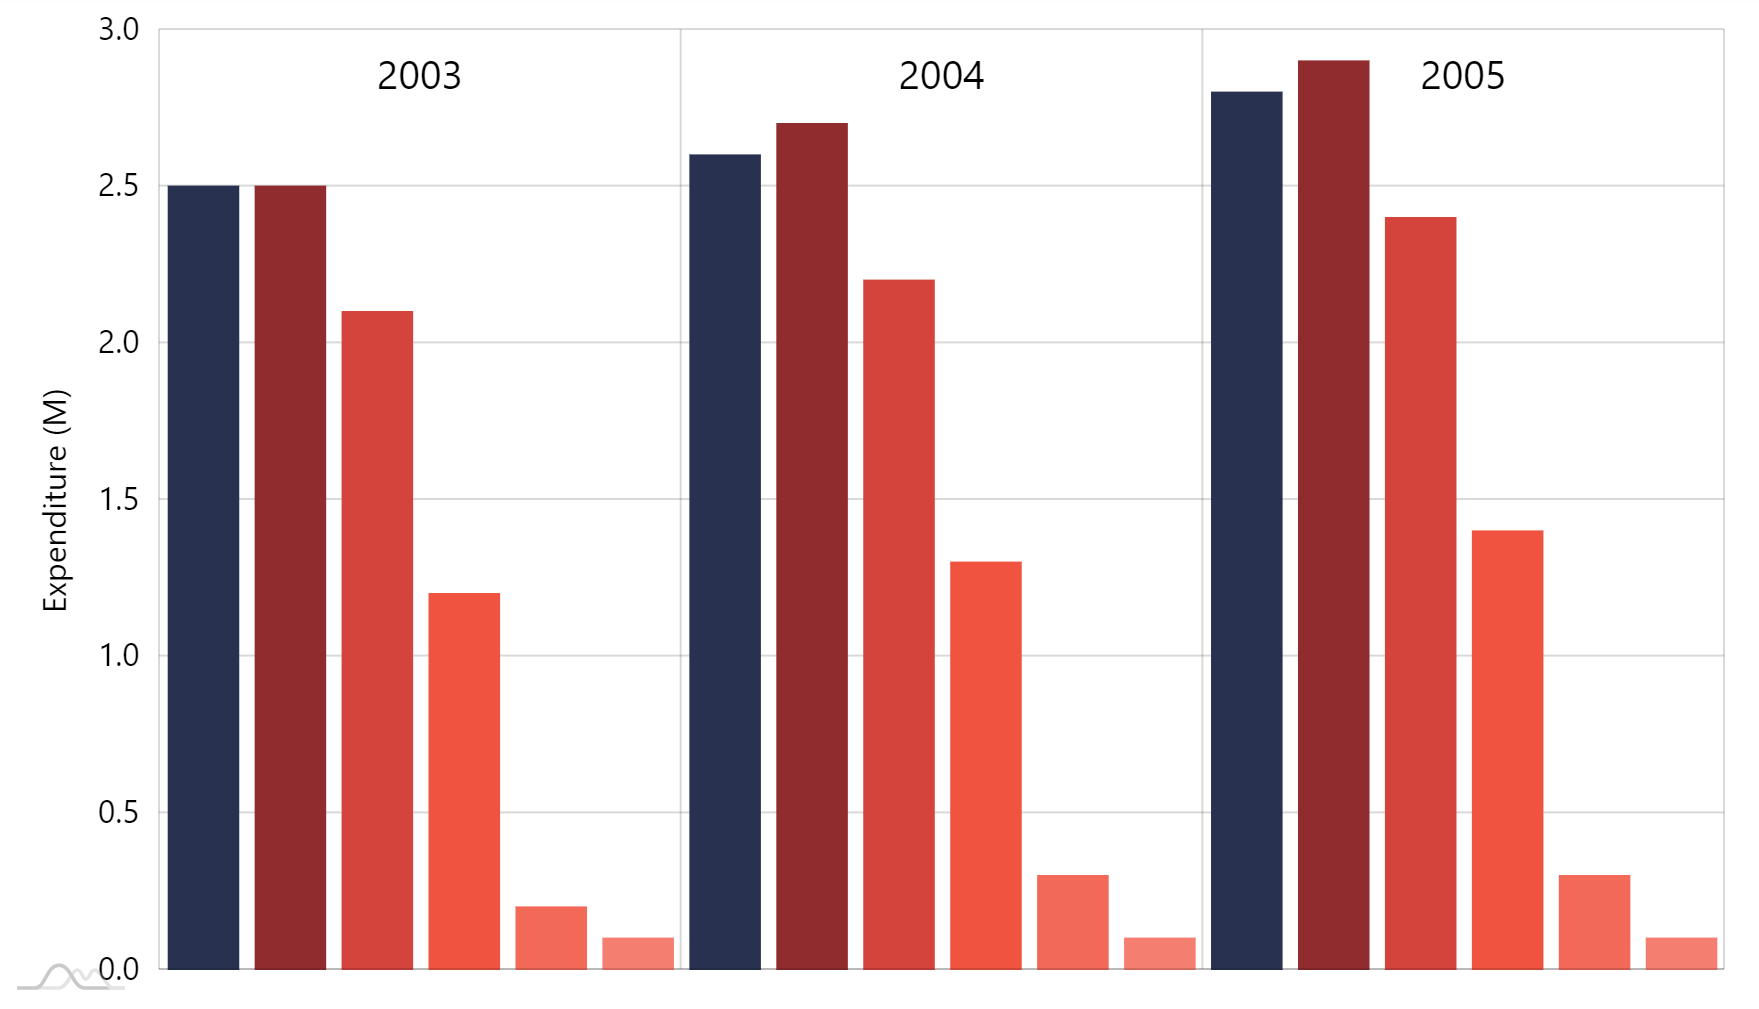
Notice how putting labels inside plot area frees up the space they previously occupied.
Label bullets
Adding
To add labels to columns we use bullets, namely LabelBullet.
We're going to add those to our Column series, have them rotated and displaying series name.
let bullet = series.bullets.push(new am4charts.LabelBullet);
bullet.label.text = "{name}";
bullet.label.rotation = 90;
bullet.label.truncate = false;
bullet.label.hideOversized = false;
var bullet = series.bullets.push(new am4charts.LabelBullet);
bullet.label.text = "{name}";
bullet.label.rotation = 90;
bullet.label.truncate = false;
bullet.label.hideOversized = false;
{
  // …
  "series": [{
    // …
    "bullets": [{
      "type": "LabelBullet",
      "label": {
        "text": "{name}",
        "rotation": 90,
        "truncate": false,
        "hideOversized": false
      }
    }]
  }, {
    // …
  }, {
    // …
  }]
}
Putting outside
We have our labels. Let's just place them where we need them to be: starting at the bottom of each column.
For that we'll need to set their location to bottom, as well as left-align them so they are not centered on the column base, but rather start there downwards.
bullet.label.horizontalCenter = "left";
bullet.locationY = 1;
bullet.dy = 10;
bullet.label.horizontalCenter = "left";
bullet.locationY = 1;
bullet.dy = 10;
{
  // …
  "series": [{
    // …
    "bullets": [{
      "type": "LabelBullet",
      "label": {
        // ...
        "horizontalCenter": "left"
      },
      "locationY": 1,
      "dy": 10
    }]
  }, {
    // …
  }, {
    // …
  }]
}

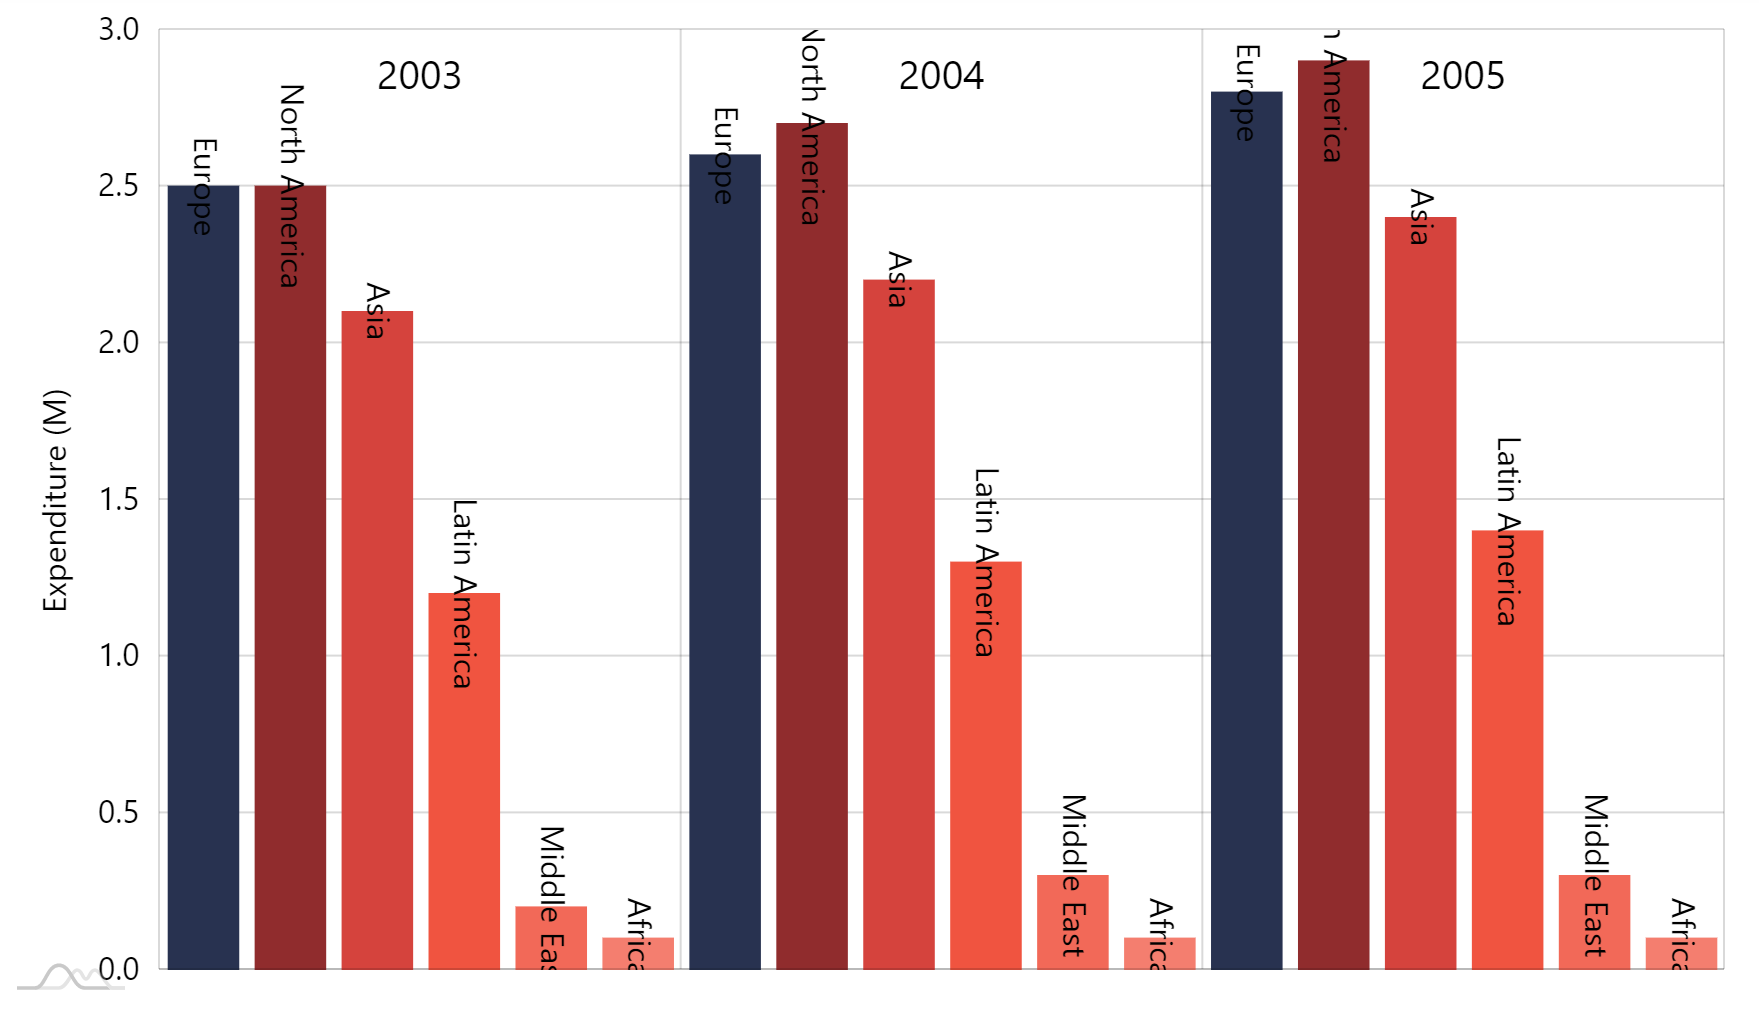
OK, now were did the labels go?
There are two things: now that they are outside and there is no space at the bottom of the chart, they do not fit.
Another thing is that whole plot area is masked, so any bullet "protruding" from it is effectively immediately.
We'll need to fix that by adding some manual padding at the bottom of the chart as well as unmasking bullets.
chart.paddingBottom = 150;
chart.maskBullets = false;
chart.paddingBottom = 150;
chart.maskBullets = false;
{
  // ...
  "paddingBottom": 150,
  "maskBullets": false
}

Phew, there they are.
Spacing out categories
The columns from different categories look too bunched up. Let's give them some breathing space by reducing width of the axis cell.
categoryAxis.renderer.cellStartLocation = 0.1;
categoryAxis.renderer.cellEndLocation = 0.9;
categoryAxis.renderer.cellStartLocation = 0.1;
categoryAxis.renderer.cellEndLocation = 0.9;
{
  // …
  "xAxes": [{
    // …
    "renderer": {
      // ...
      "cellStartLocation": 0.1,
      "cellEndLocation": 0.9
    }
  }]
}

Final touch
Now, let's make our columns a bit fatter, ant we can call it a day:
series.columns.template.width = am4core.percent(95);
series.columns.template.width = am4core.percent(95);
{
  // …
  "series": [{
    // …
    "columns": {
      "width": "95%"
    }
  }, {
    // …
  }, {
    // …
  }]
}

All done.
Working example
See the Pen amCharts 4: Clustered series with individual names as categories by amCharts team (@amcharts) on CodePen.