ValueAxis is a clever kid. It will try to space out its grid/labels in a way that they come in non-crowded "pretty" increments, e.g. in 10 incremental steps. But what if we want to show custom step increments, like every 25? This tutorial will explain how to do that.
Default functionality 
Desired functionality
The task
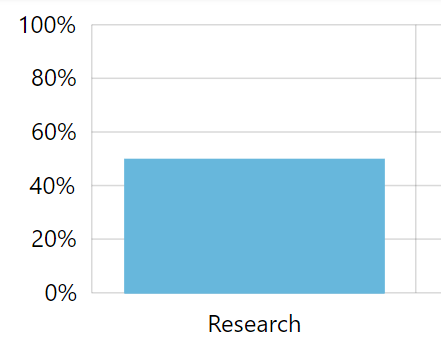
Here's a very basic chart:
See the Pen amCharts 4: Custom grid/labels using axis ranges by amCharts team (@amcharts) on CodePen.
Given available height, the axis chose to display a label every 20, which is a multiple of 10.
We need to display a number every 25, or rather only numbers that are multiples of 25.
However, there's no way to set such non-standard step for the axis.
Let's see how we can work around that.
Using axis ranges
The only solution is this:
- Disable axis labels and grid altogether.
- Add axis ranges with labels at precisely the values we want them to appear.
Disabling grid and labels
To disable built-in grid lines and labels, we'll access axis' their respective templates:
valueAxis.renderer.grid.template.disabled = true;
valueAxis.renderer.labels.template.disabled = true;
valueAxis.renderer.grid.template.disabled = true;
valueAxis.renderer.labels.template.disabled = true;
{
  // …
  "yAxes": [{
    // …
    "renderer": {
      "grid": {
        "disabled" : true
      },
      "labels": {
        "disabled" : true
      }
    }
  }]
}
Adding ranges
Axis ranges have multiple uses. For more information about them read here. However, for our purposes here, we are going to use their functionality as labelled guides only.
Since we don't want to repeat the code multiple times, let's build a function that creates those ranges:
function createGrid(value) {
  let range = valueAxis.axisRanges.create();
  range.value = value;
  range.label.text = "{value}";
}
function createGrid(value) {
  var range = valueAxis.axisRanges.create();
  range.value = value;
  range.label.text = "{value}";
}
function createGrid(value) {
  return {
    "value": value,
    "label": {
      "text": "{value}}
    }
  };
}
Then we can just use it to create multiple ranges with simple one-liners:
createGrid(0);
createGrid(25);
createGrid(50);
createGrid(75);
createGrid(100);
createGrid(0);
createGrid(25);
createGrid(50);
createGrid(75);
createGrid(100);
{
  // …
  "yAxes": [{
    // …
    "axisRanges": [
       createGrid(0),
       createGrid(25),
       createGrid(50),
       createGrid(75),
       createGrid(100)
    ]
  }]
}
Example
See the Pen amCharts 4: Custom grid/labels using axis ranges by amCharts team (@amcharts) on CodePen.