This tutorial will show how you can use additional series to apply individual thresholds to columns in a ColumnSeries.
The task
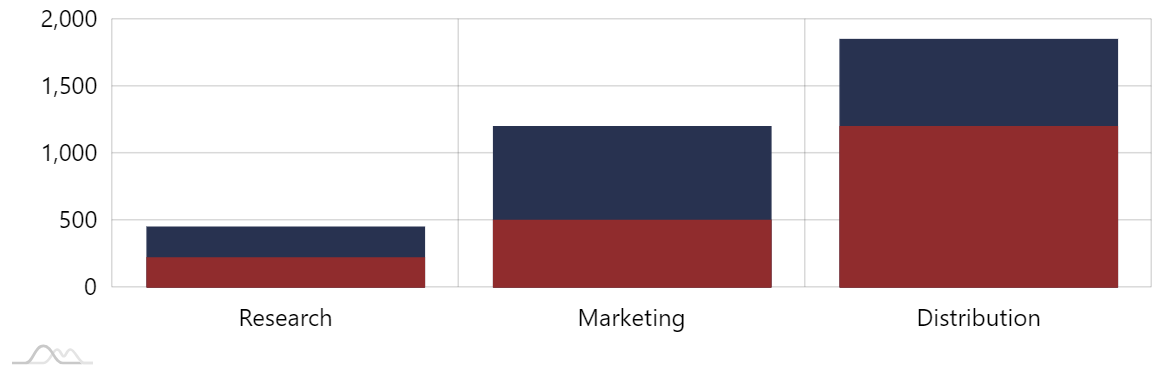
Say we have a column chart and would like to apply individual threshold values for each column.
Our data might look something like this:
[{
  "category": "Research",
  "value": 450,
  "threshold": 220
}, {
  "category": "Marketing",
  "value": 1200,
  "threshold": 500
}, {
  "category": "Distribution",
  "value": 1850,
  "threshold": 1200
}]
The value is the absolute value, and threshold is a value we want to show some cut off indicator at.
Something like this:

Let's see how we can make that happen.
Adding fill
If we had a universal threshold value (common for all columns) we could easily use a series axis range for that.
Since that's not the case, we are going to be using another ColumnSeries placed over the main one, to simulate the fill to a specific (threshold) value.
let series2 = chart.series.push(new am4charts.ColumnSeries());
series2.dataFields.valueY = "threshold";
series2.dataFields.categoryX = "category";
series2.clustered = false;
var series2 = chart.series.push(new am4charts.ColumnSeries());
series2.dataFields.valueY = "threshold";
series2.dataFields.categoryX = "category";
series2.clustered = false;
{
  // ...
  "series": [{
    // ...
  }, {
    "type": "ColumnSeries",
    "dataFields": {
      "valueY": "threshold",
      "categoryX": "category"
    },
    "clustered": false
  }]
}
NOTE Notice how we also need to set clustered = false for the "fill" series. Without it, columns of both the original and fill series would be placed side by side (clustered), not laid over each other.
We do have our fill, let's see how we can add the "cutoff" line.
Adding cutoff line
For the lines we are going to be using a series of type StepLineSeries.
It's convenient, because it will display horizontal lines at specific values, and the vertical sections (risers) can be disabled, leaving only horizontal lines.
let series3 = chart.series.push(new am4charts.StepLineSeries());
series3.dataFields.valueY = "threshold";
series3.dataFields.categoryX = "category";
series3.strokeWidth = 3;
series3.strokeDasharray = "3,3";
series3.noRisers = true;
series3.startLocation = 0.05;
series3.endLocation = 0.95;
var series3 = chart.series.push(new am4charts.StepLineSeries());
series3.dataFields.valueY = "threshold";
series3.dataFields.categoryX = "category";
series3.strokeWidth = 3;
series3.strokeDasharray = "3,3";
series3.noRisers = true;
series3.startLocation = 0.05;
series3.endLocation = 0.95;
{
  // ...
  "series": [{
    // ...
  }, {
    // ...
  }, {
    "type": "StepLineSeries",
    "dataFields": {
      "valueY: "threshold",
      "categoryX": "category
    },
    "strokeWidth": 3,
    "strokeDasharray": "3,3",
    "noRisers": true,
    "startLocation": 0.05,
    "endLocation": 0.95
  }]
}
Let's explore a few settings:
strokeDasharraymakes the line dashed, or rather dotted in our case.noRisersis responsible for disabling vertical sections of the step series.startLocationandendLocationspecify where relatively to the available cell width to start and end the line (without them the line would span the whole width of the cell).
Working example
See the Pen amCharts 4: Using Step line series for individual category tresholds by amCharts team (@amcharts) on CodePen.