WordPress being the single most used web publishing platform, is perfect for when you want your website up and running in minutes.
However, when it comes to dynamic content, such as JavaScript, you’ll find that there’s practically no options in the plain vanilla WP install.
This is precisely the reason why we went ahead and created our own, official WordPress plugin. It allows adding dynamic charts and maps to your posts and pages a breeze.
Continue with this tutorial for step-by-step instructions.
Installing the plugin
To install the plugin, simply go to your Plugins section in WP admin, click "Add New" and search for "amCharts", then click on "Install Now" next to the "amCharts: Charts and maps".
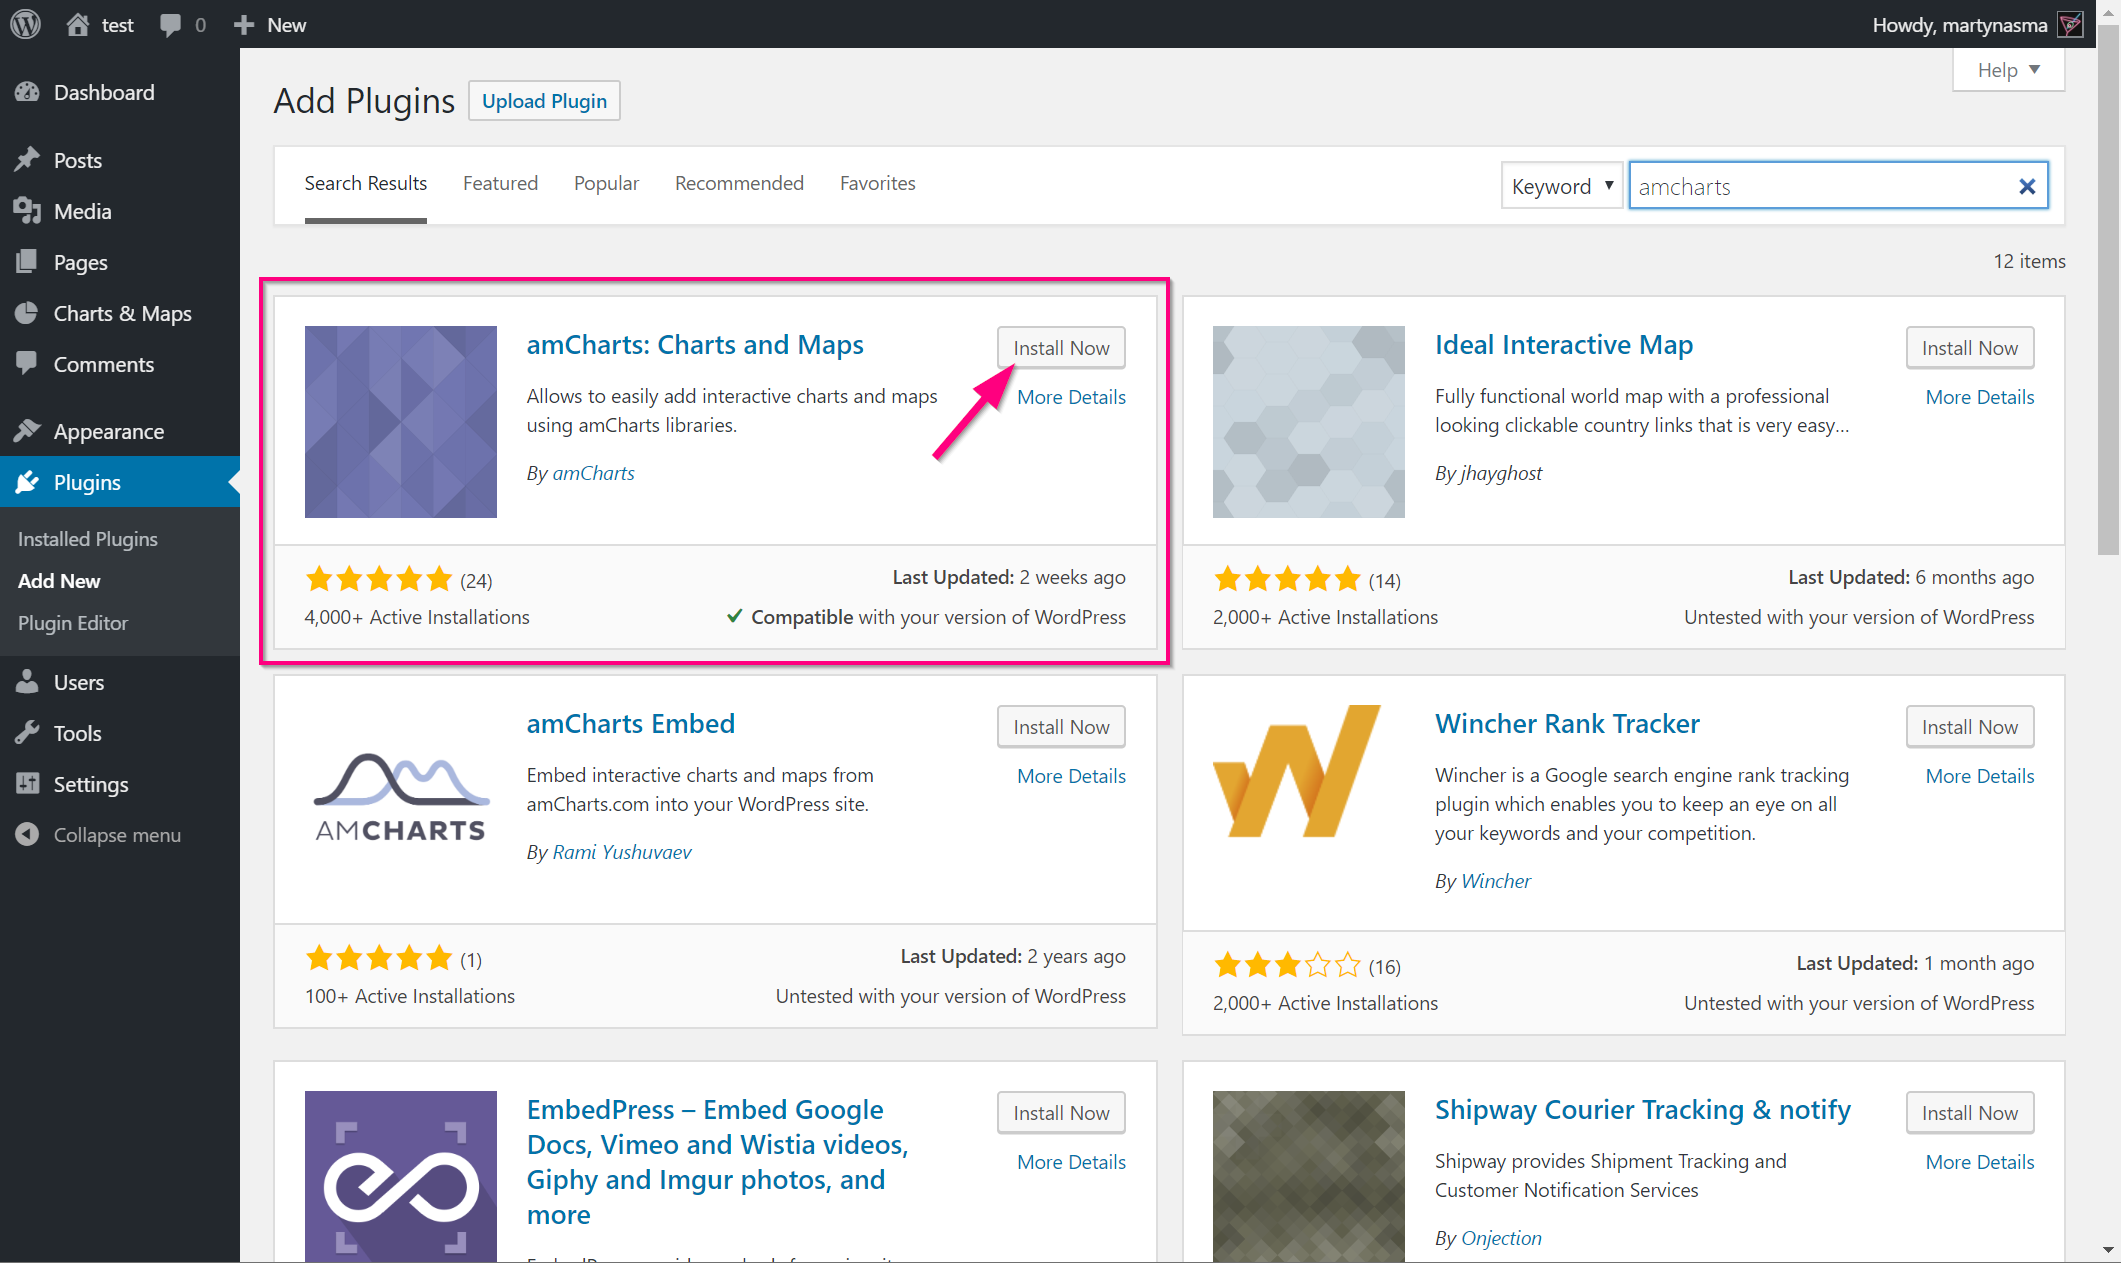
WP will install the plugin. Make sure you click "Activate" when the button pops up instead of "Install Now".
You’re all set.
Configuring the plugin
The plugin comes with 100% usable default configuration. If you’d like to tinker with the config, you’ll find it under Settings > Charts & Maps.
Most of the users might skip this, and dive right in.
Use config page to:
- Set the location from where to load amCharts files. (it loads those files directly from amCharts CDN servers by default)
- Edit default code templates for each chart type
- Other options
Creating a chart
There are several ways to create a chart or map. You can either use a default template or start from scratch.
Starting from scratch
To create a new chart or a map we click "Add New" under "Charts & Maps" in WP admin.
You’ll get a familiar post edit interface with a few additional fields.
The "Title" field is the same field you have for all of the WP posts, pages and other content types. Make it something meaningful, so that when you have a lot of charts, you exactly know what it does.
Naming your chart with something like "Chart 1" is not as descriptive as "Pie chart for expenditures by department for 2019".
Resources box holds all the JavaScript and CSS files you will need for this chart. All amCharts instances require the core.js and charts.js files. Depending on your requirements, it may need additional files, such as plugins, themes, or map definition files (geodata).
Maps require core.js and maps.js, as well as a map definition file, such as worldLow.js.
Resource box needs to show either relative or absolute path, with the latter being recommended.
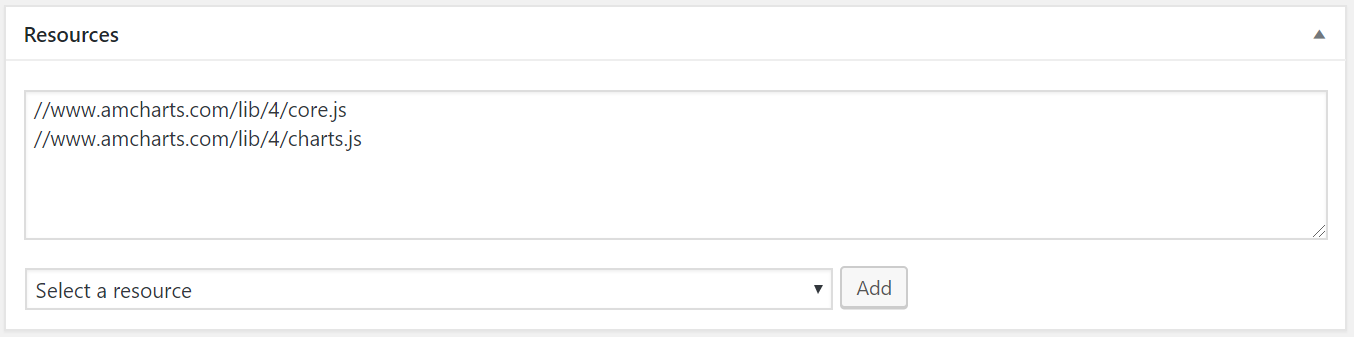
If you don’t want to enter those links, you can use the "Select a resource" dropdown to quickly add the link to a resource.
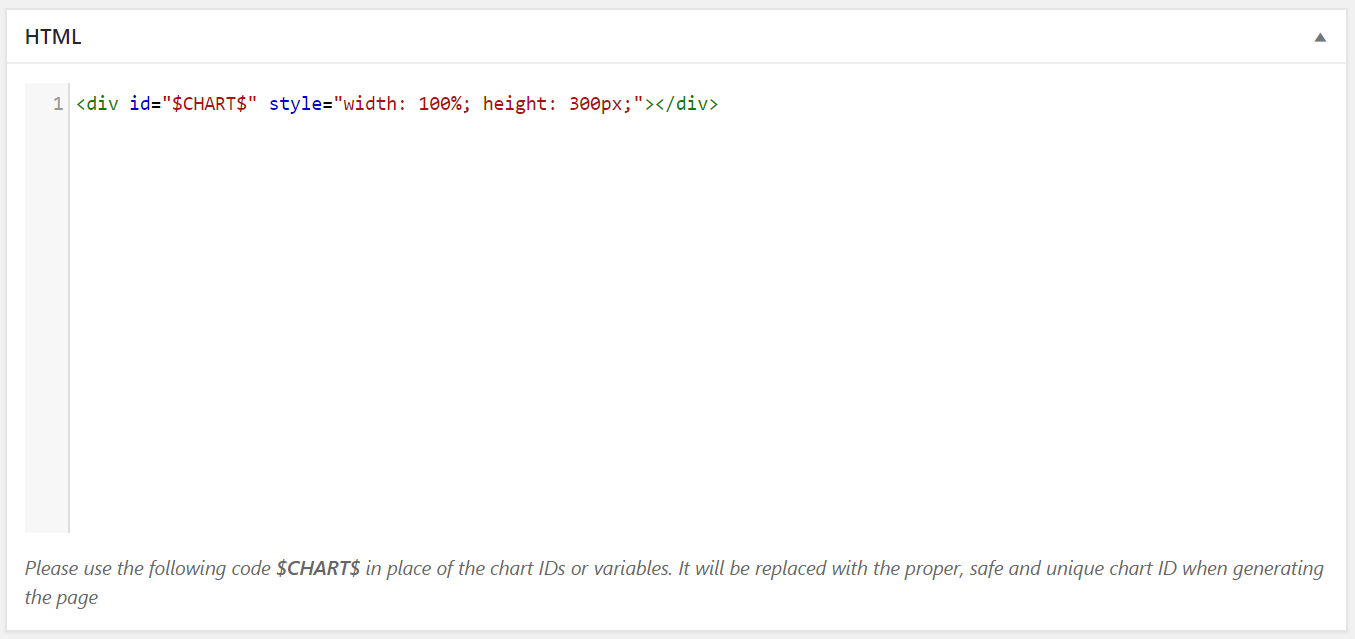
HTML box is where your HTML part goes. Most often it’s a <div> tag that defines the container in which to store the chart or map.
Important part is it’s id property. It’s an identification which will be used by the chart to determine where it should be stored in.
You can provide static id, like "mychart". However, we recommend using a special code "$CHART$". When generating the chart, WordPress will replace this with a unique id, which will make it safe to have multiple charts on the same page.
Also, you probably want to set it’s style to give it some width and height:
JavaScript box is where all the magic happens. It contains the actual JavaScript code for the chart or map.
Most of the amCharts-enabled charts or maps start with a call of am4core.create() function call.
For example the following code creates a fully functional Pie chart:
// Create chart instance
var chart = am4core.create("$CHART$", am4charts.PieChart);

// Set data
chart.data = [{
  "country": "Lithuania",
  "litres": 501.9
}, {
  "country": "Czechia",
  "litres": 301.9
}, {
  "country": "Ireland",
  "litres": 201.1
}, {
  "country": "Germany",
  "litres": 165.8
}, {
  "country": "Australia",
  "litres": 139.9
}];

// Add series
var series = chart.series.push(new am4charts.PieSeries());
series.dataFields.value = "litres";
series.dataFields.category = "country";

// Add legend
chart.legend = new am4charts.Legend();
Notice the "$CHART$" is here again.
You are encouraged to use this code whenever you want some uniqueness. When displaying the chart, the plugin will replace it with something unique like "amchart1" for each instance on the same page.
For example if you have three charts on the same page, the first one will replace all occurrences of "$CHART$" to "amchart1", the second to "amchart2", etc. thus preserving the uniqueness and avoiding any potential id conflicts.
Using a pre-defined template
Let’s say, I want to create a Pie chart. It might be easier to start from a working Pie chart, then just modify it’s code.
To do that, we can click on the "Charts & Maps" item in WP admin menu, then select "+ Pie".

You’ll notice that all fields we discussed in previous section are prefilled with code.
At this point, if you press "Preview chart or map" you’ll get a fully functional Pie chart.
Edit the code, publish the chart.
Previewing the chart
Once you’re ready to preview how your chart looks in real life, hit the "Preview chart or map" button which is located in the box on the left.
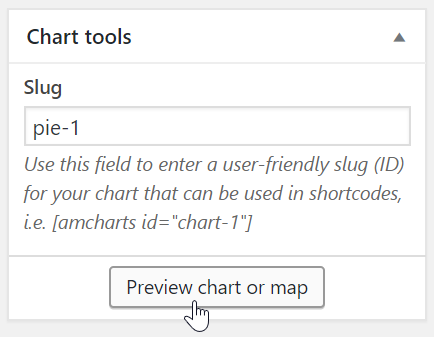
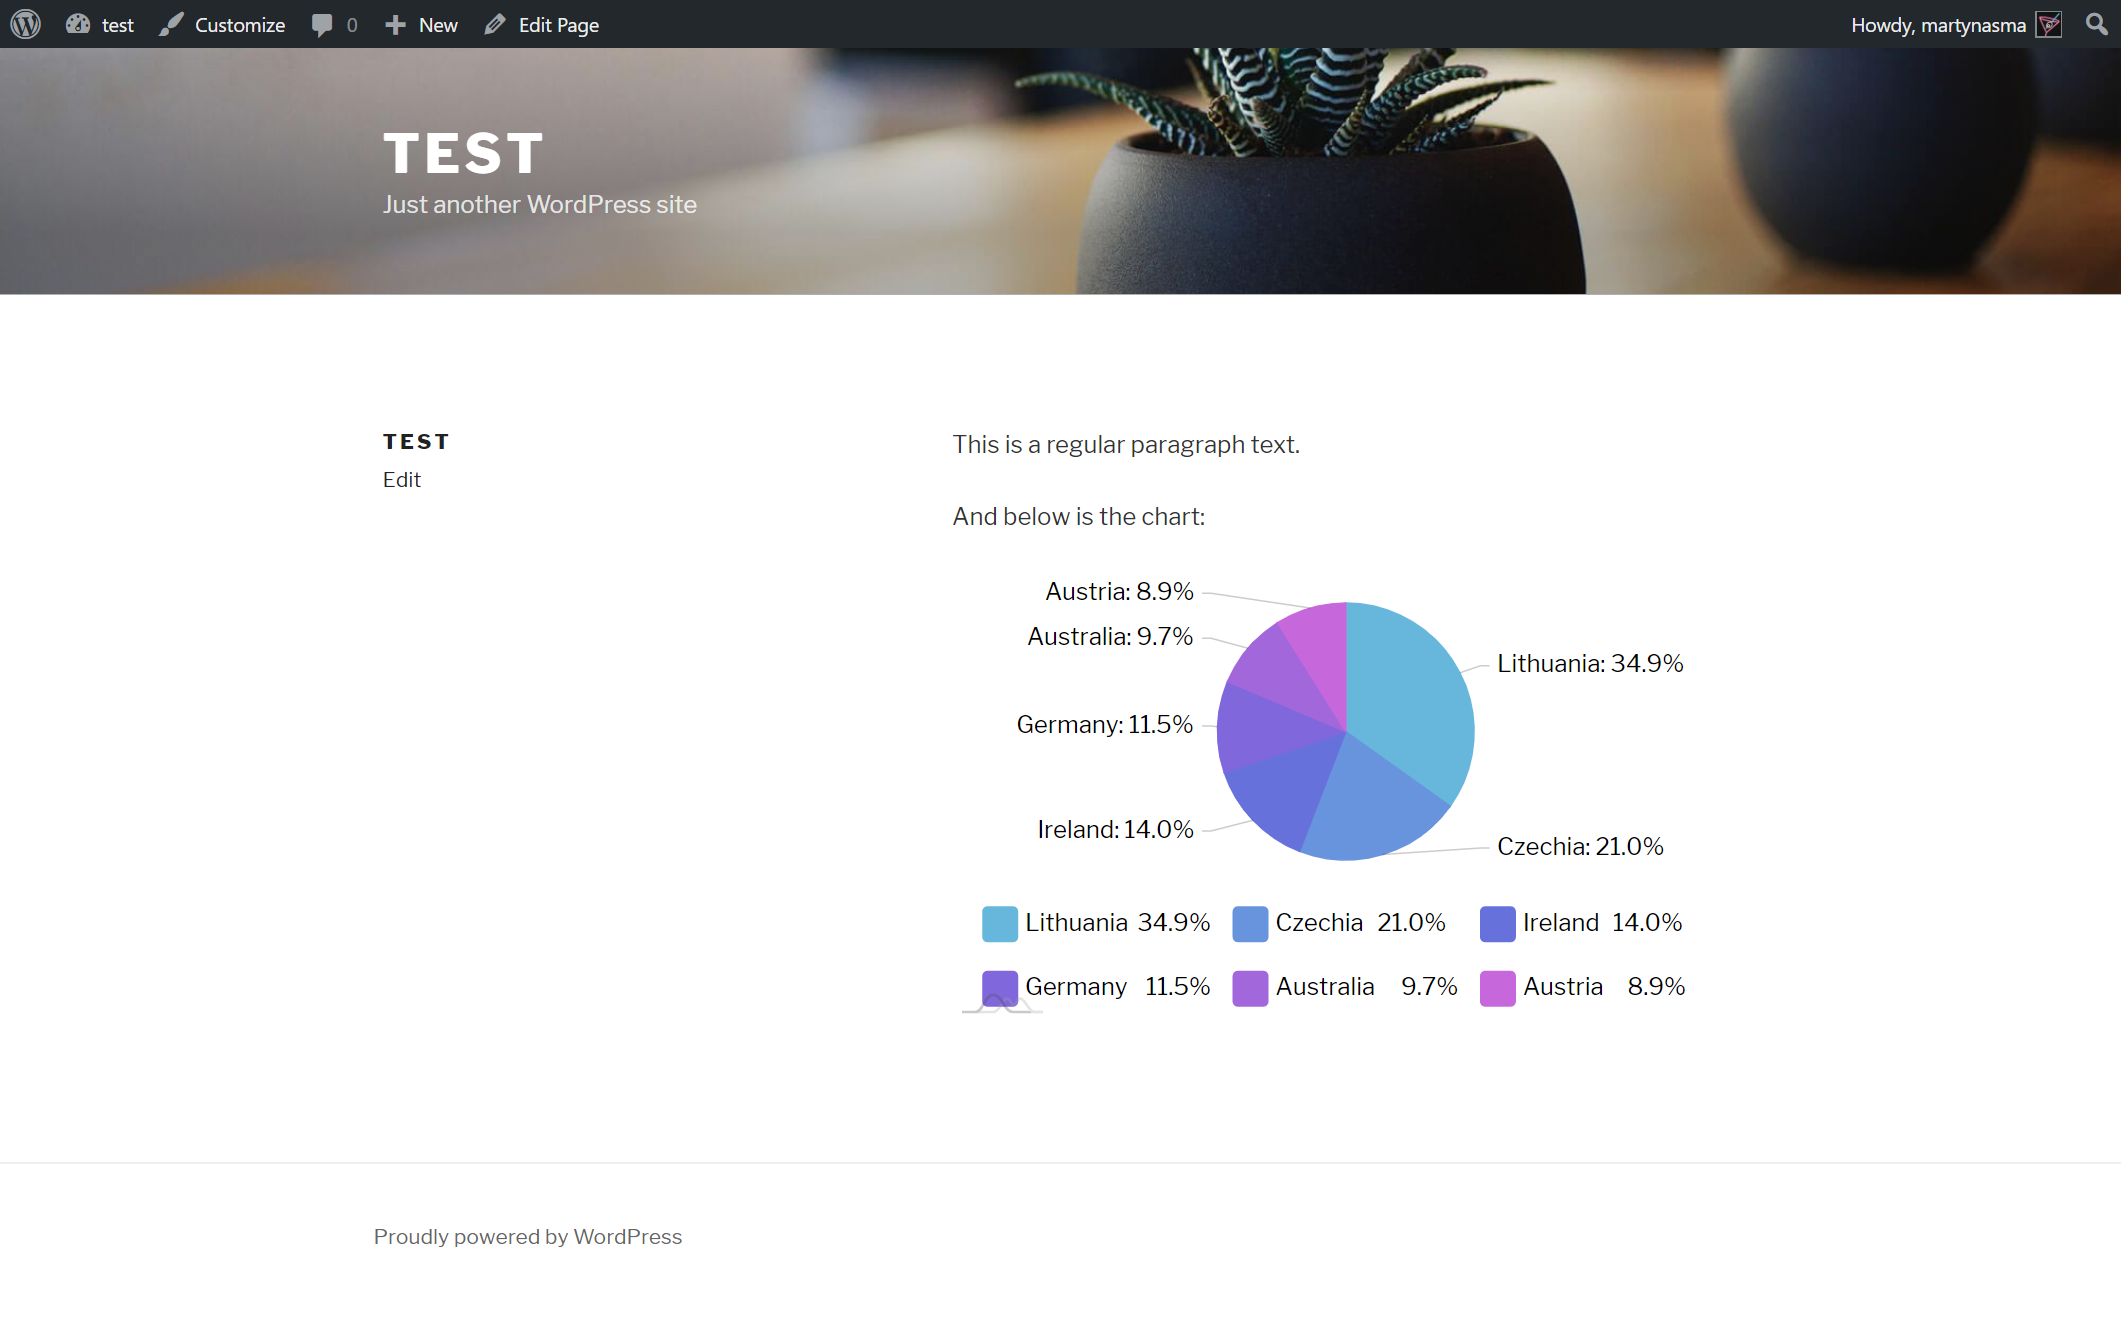
A new window/tab will open with the chart shown wrapped in your website’s real theme.
Publishing the chart
As with any other chart WordPress content, before it can be shown on a live website, you’ll need to publish it, by hitting the "Publish" button.
That’s all to creating charts. Now, let’s move on to displaying them.
Inserting into posts and pages
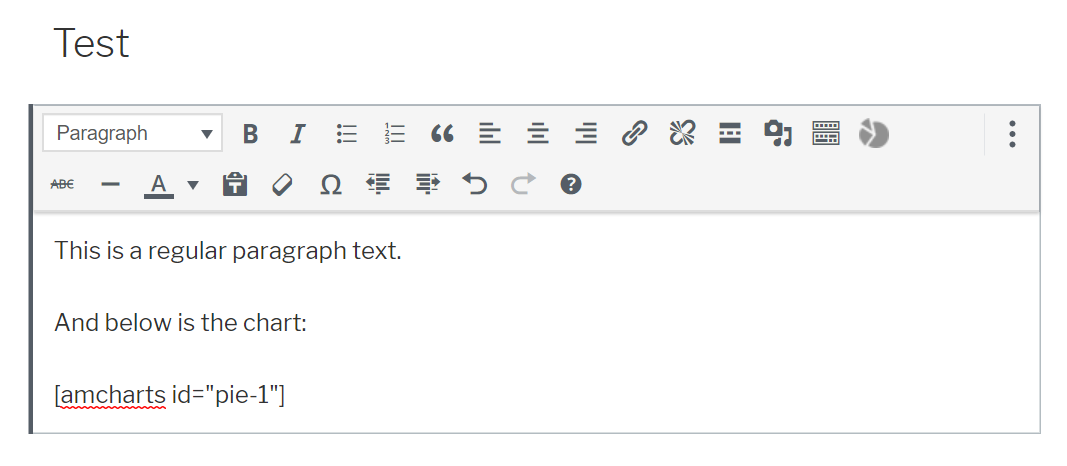
You can insert special embed codes into any WordPress page or post, called shortcodes.
An amCharts shortcode follows the syntax [amcharts id="..."] where id is the user-friendly slug you entered (or let the plugin assign on) when creating the chart.
You can either enter the shortcode yourself, or use the special icon in editor.
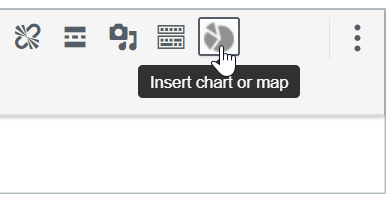
NOTE At this time amCharts WP plugin does not support native Guttenberg editor blocks. You can use a shortcode to insert charts into regular paragraph blocks, or add "Classic" block to use the chart insert icon as shown above.
It will bring up a modal window, which will display a searchable list of charts you have created.

Just click on the one you want to be added to the page and the plugin will insert a proper shortcode for it.
Now, when you save your page and view it on the live website, you’ll see the the shortcode being replace by the real chart.