Normally, all initialized Value Axes are shown, even if they do not have any visible Series attached to them. This also means that when Series is toggled off, the related Value Axis will remain. This tutorial will show how we can toggle axes off together with Series.
The problem
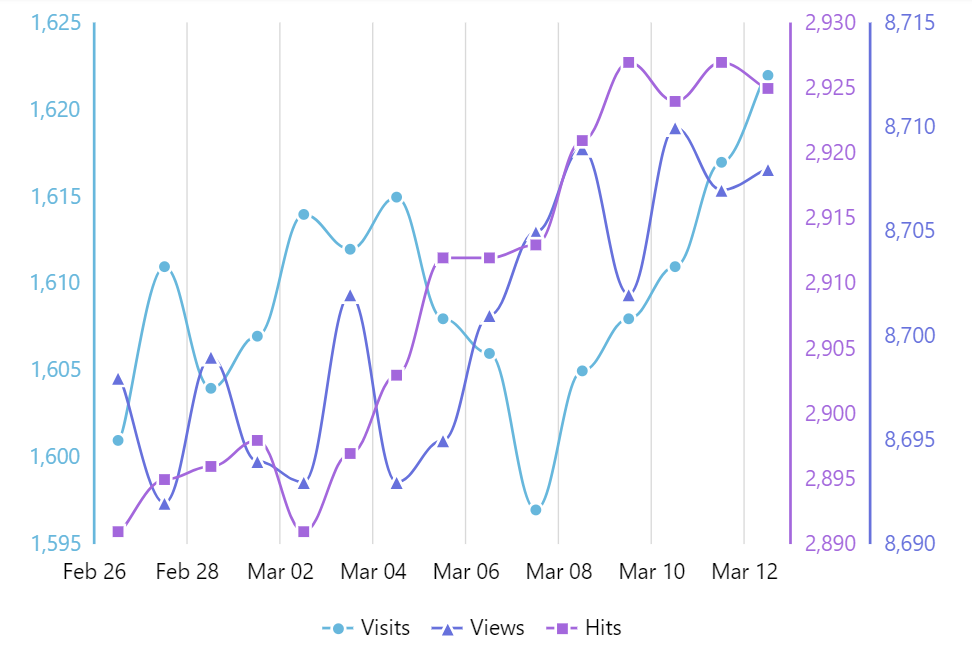
Let's take a simple multi-series multi-axes chart. Each LineSeries has different value scale and thus separate ValueAxis attached to them.
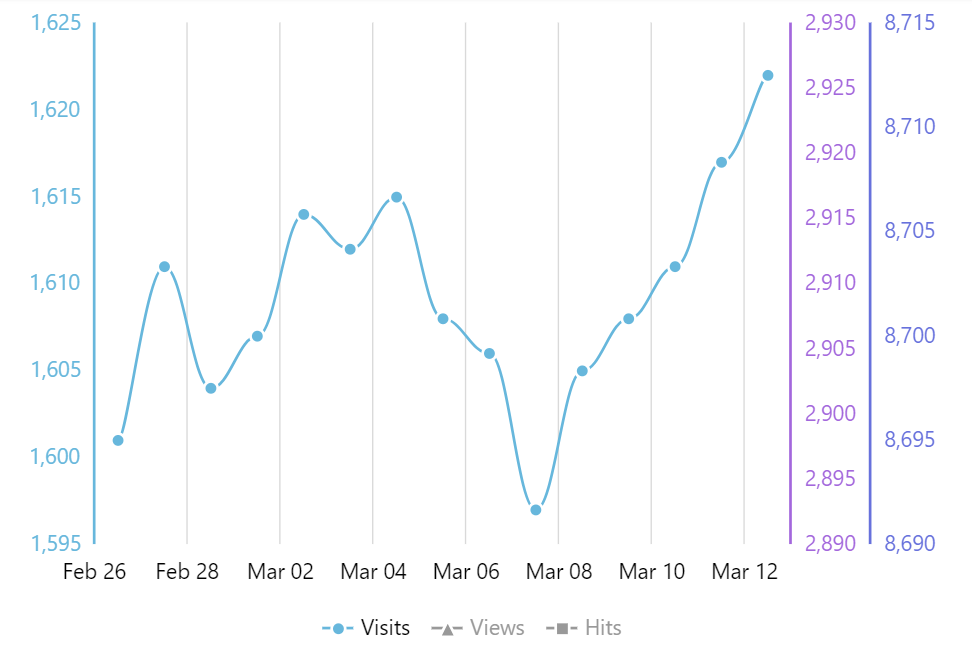
It all looks fine and good when all series are visible. However, if some of those are toggled off, the remaining "empty" axes might start looking a bit off.
The solution
Turning off an axis
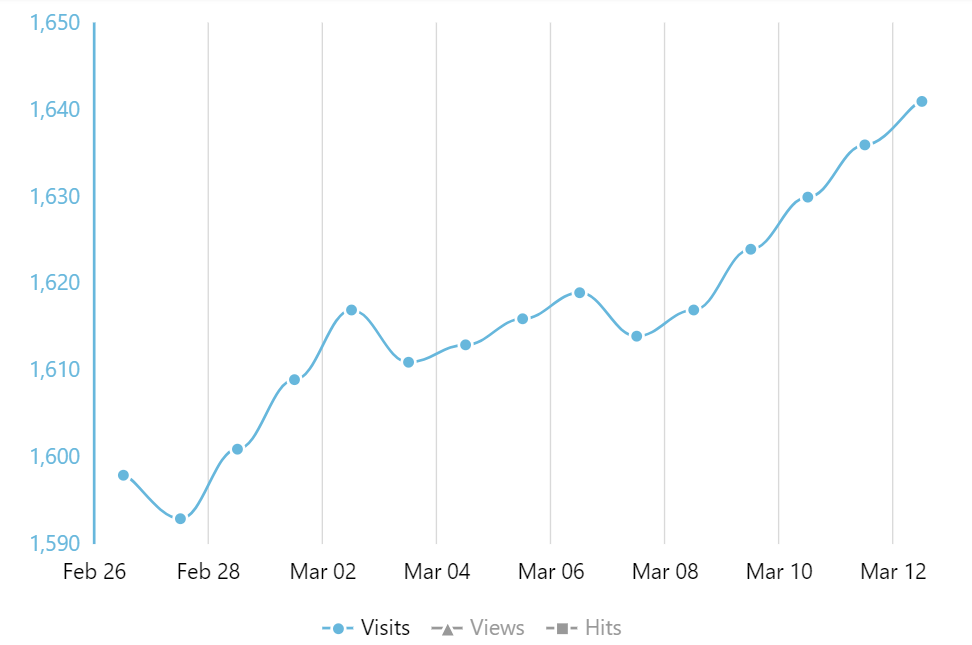
To "turn off" an axis, all we need to do is to set is disabled property to true. This will remove axis from display, as well as free up space occupied by it for the chart itself.
axis.disabled = true;
axis.disabled = true;
Don't worry, the above is just a associative example. We'll put it into context shortly.
Catching toggle events
Obviously, we need to initiate the toggling of axes when Series is either hidden or shown back on.
For that we are going to be using Series' "hidden" and "shown" events respectively.
series.events.on("hidden", function(ev) {
  // Hide axis
});
series.events.on("shown", function(ev) {
  // Show axis
});
series.events.on("hidden", function(ev) {
  // Hide axis
});
series.events.on("shown", function(ev) {
  // Show axis
});
{
  // ...
  "series": [{
    // ...
    "events": {
      "hidden": function(ev) {
        // Hide axis
      },
      "shown": function(ev) {
        // Show axis
      }
    }
  }]
}
Tying it all together
Now that we know how to turn the axis off and turn it back on, as well as how to catch events when those actions need to happen, we can tie it all into something useful.
Since we are thinking about all possible scenarios, where there can be more than one Series attached to an Axis, we're also going to check whether all of the series on the specific axis are toggled off before toggling the axis off itself.
We're also going to construct a universal function that will do that for us.
Here we go:
series1.events.on("hidden", toggleAxes);
series1.events.on("shown", toggleAxes);

series2.events.on("hidden", toggleAxes);
series2.events.on("shown", toggleAxes);

series3.events.on("hidden", toggleAxes);
series3.events.on("shown", toggleAxes);

function toggleAxes(ev) {
  let axis = ev.target.yAxis;
  let disabled = true;
  axis.series.each(function(series) {
    if (!series.isHiding && !series.isHidden) {
      disabled = false;
    }
  });
  axis.disabled = disabled;
}
series1.events.on("hidden", toggleAxes);
series1.events.on("shown", toggleAxes);

series2.events.on("hidden", toggleAxes);
series2.events.on("shown", toggleAxes);

series3.events.on("hidden", toggleAxes);
series3.events.on("shown", toggleAxes);

function toggleAxes(ev) {
  var axis = ev.target.yAxis;
  var disabled = true;
  axis.series.each(function(series) {
    if (!series.isHiding && !series.isHidden) {
      disabled = false;
    }
  });
  axis.disabled = disabled;
}
var chart = am4core.createFromConfig({
  // ...
  "series": [{
    // ...
    "events": {
      "hidden": toggleAxes,
      "shown": toggleAxes
    }
  }]
}, "chartdiv", am4charts.XYChart);

function toggleAxes(ev) {
  var axis = ev.target.yAxis;
  var disabled = true;
  axis.series.each(function(series) {
    if (!series.isHiding && !series.isHidden) {
      disabled = false;
    }
  });
  axis.disabled = disabled;
}
Example
See the Pen amCharts 4: Auto-hide value axis when related series is hidden by amCharts team (@amcharts) on CodePen.


