Every line in amCharts - including outlines of other shapes - can be made dotted or dashed. This short tutorial will show how it works.
Enabling dashed line
You probably already know that setting color of a line (or and outline of a shape) is as easy as setting its stroke property, e.g.:
series.stroke = am4core.color("#f00");
series.stroke = am4core.color("#f00");
{
  // ...
  "series": [{
    // ...
    "stroke": "#f00"
  }]
}
The above will make LineSeries lines use red color:
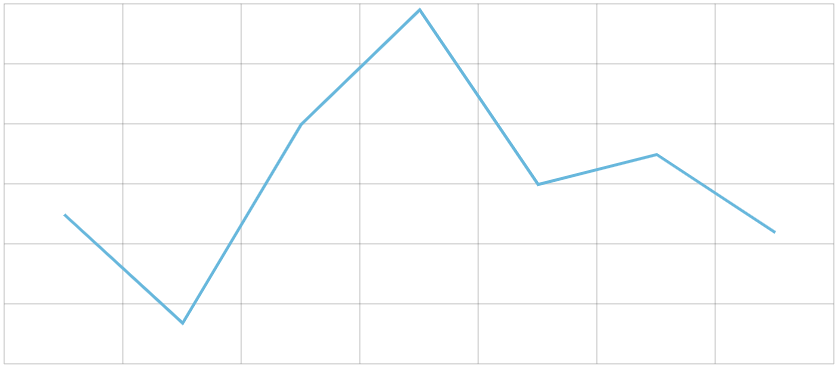
Default color 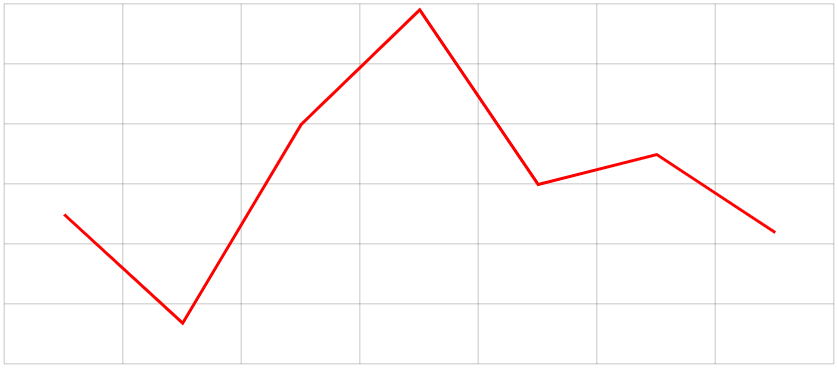
stroke = am4core.color("#f00")
Making line dashed works the same way, by setting strokeDasharray property.
series.strokeDasharray = "3,3";
series.strokeDasharray = "3,3";
{
  // ...
  "series": [{
    // ...
    "strokeDasharray": "3,3"
  }]
}
strokeDasharraynot set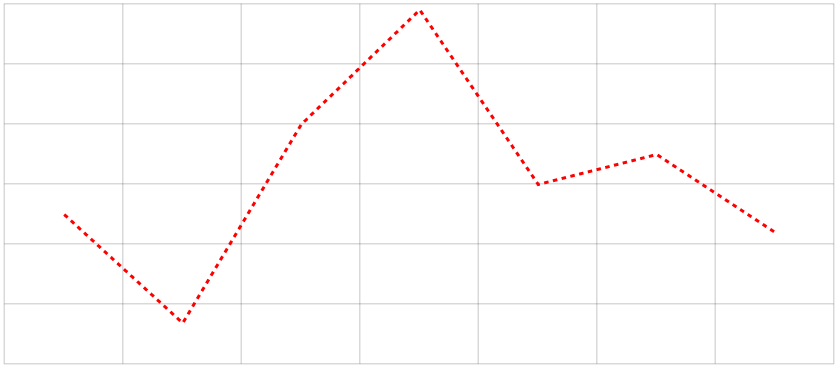
strokeDasharray = "3,3"
Dasharray values
Basically, strokeDasharray value allows setting lengths of dashes, spacing between them, and even create intricate complex line styles.
The above example of "3,3" means "create dashes 3 pixel in lengths with spacing of 3 pixels between them".
If we'd like to create dotted line, we'd set dash length to whatever strokeWidth we have. In our case that would be "2,3".
NOTE Mozilla explains it better: It's a list of comma and/or white space separated s and s that specify the lengths of alternating dashes and gaps. If an odd number of values is provided, then the list of values is repeated to yield an even number of values. Thus, 5,3,2 is equivalent to 5,3,2,5,3,2.
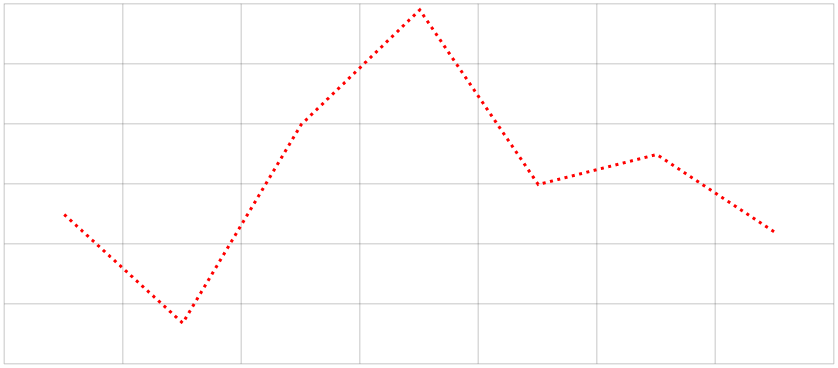
strokeDasharray = "2,4"
strokeDasharray = "8,4"
strokeDasharray = "8,4,2,4"
Applying to various objects
We've already seen how to apply dash setting to a LineSeries. It works similarly to other elements.
Axis grid
axis.renderer.grid.template.strokeDasharray = "3,3"
axis.renderer.grid.template.strokeDasharray = "3,3"
{
  // ...
  "yAxes": [{
    // ...
    "renderer": {
      "grid": {
        "strokeDasharray": "3,3"
      }
    }
  }]
}
Axis range line
range.grid.strokeDasharray = "3,3"
range.grid.strokeDasharray = "3,3"
{
  // ...
  "yAxes": [{
    // ...
    "axisRanges": [{
      // ...
      "grid": {
        "strokeDasharray": "3,3"
      }
    }]
  }]
}
Tooltip outline
series.tooltip.background.strokeDasharray = "3,3"
series.tooltip.background.strokeDasharray = "3,3"
{
  // ...
  "series": [{
    // ...
    "tooltip": {
      "background": {
        "strokeDasharray": "3,3"
      }
    }
  }]
}
Example
See the Pen amCharts 4: Using strokeDasharray by amCharts team (@amcharts) on CodePen.