By default ColumnSeries will size its columns so they are both as wide as possible, while maintaining some spacing between individual columns in clusters and between categories/cells. This tutorial will explain how we can manipulate width and spacing of the columns.
Understanding cell width
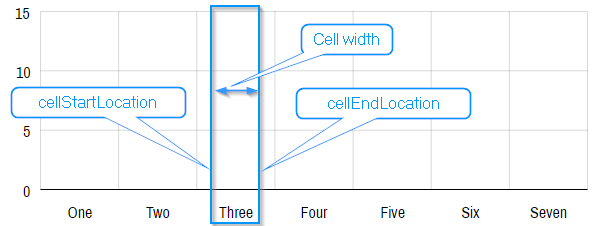
Before we begin, let's figure out what we mean when we say "cell" and what do we mean by "cell width".
Any type of axis - not just Category axis - is divided into increments, usually framed by grid lines and identified by a single axis label.
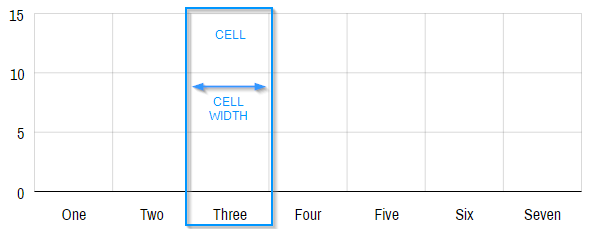
The above is a Category axis. It works identically on other axis types. For example, a day on a Date axis might represent a cell.
In a nutshell, a cell is space between two adjacent grid lines.
Setting column width
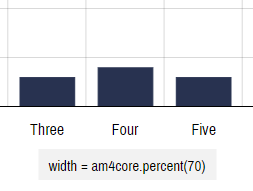
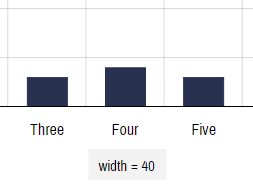
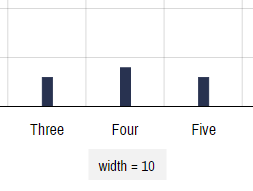
Width of the columns in a Column series can either be set relatively to the cell width, or to an absolute pixel value.
We set it via width property of the column template, e.g.:
series.columns.template.width = am4core.percent(70);
series.columns.template.width = am4core.percent(70);
{
  // ...
  "series": [{
    "type": "ColumnSeries",
    // ...
    "columns": {
      "width": "70%"
    }
  }]
}
See the Pen amCharts 4: Column width (1) by amCharts (@amcharts) on CodePen.
The default is 80%.
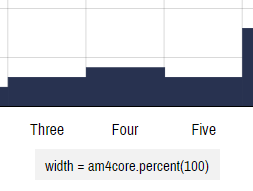
The relative setting basically means how much of the cell space should the column occupy.
100% will make column occupy the whole of the cell, while 50% will take up just half of its width.

Setting cell width
Up until now, we have been operating under assumption that the whole cell width is available to the column. Basically the actual width of the cell is the "cell width".
This can be changed using two of the Axis renderer's settings: cellStartLocation and cellEndLocation.
Both of these are relative values in the range from 0 (zero) to 1 (one), where 0 means start of the cell and 1 end of it.
By default, the whole cell width is available to columns, which means that cellStartLocation = 0 and cellEndLocation = 1.
Naturally, if we update these two settings, we will change the "cell width" which is available to the columns.
Important thing to understand is that column's width is always relative to the available "cell width" which can be modified using Axis renderer's settings, and thus is not necessarily full space between the grid lines.
So, say we set cellStartLocation = 0.2 and cellEndLocation = 0.8. Since we chip off 20% from the cell's left and right (start and end), actual width left to the column will be 60%.
If our column width in turn is set to, say, 50%, the actual width of the column will end up 30% - half of the 60% that was left for the cell width after we applied start/end locations.
categoryAxis.renderer.cellStartLocation = 0.2;
categoryAxis.renderer.cellEndLocation = 0.8;

//...

series.columns.template.width = am4core.percent(50);
categoryAxis.renderer.cellStartLocation = 0.2;
categoryAxis.renderer.cellEndLocation = 0.8;

// ...

series.columns.template.width = am4core.percent(50);
{
  // ...
  "xAxes": [{
    // ...
    "renderer": {
      "cellStartLocation": 0.2,
      "cellEndLocation": 0.8
    }
  }],
  "series": [{
    "type": "ColumnSeries",
    // ...
    "columns": {
      "width": "50%"
    }
  }]
}
See the Pen amCharts 4: Column width (2) by amCharts (@amcharts) on CodePen.
Here are more experiments with start and end locations:
Column clusters
Now, what happens when we have not one column but a cluster of columns from multiple series?
In such case, the "cell width" is divvied up into equal parts for each column (or stack of columns).
Each such divvied part becomes each individual column's own personal "cell width", against which column's width is measured.

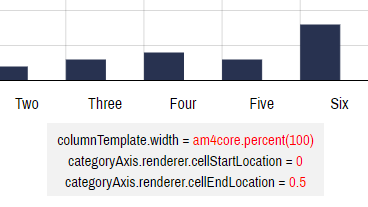
Note how space left after chipping off cellStartLocation and cellEndLocation.
Let's see how this works in actual setup.
See the Pen amCharts 4: Column width (3) by amCharts (@amcharts) on CodePen.
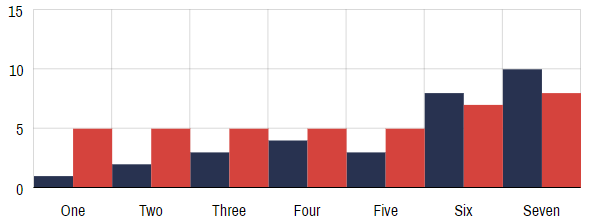
Since we have default settings in the above chart, the whole width of each cell is available for columns.
There are two columns, so the space is divided to equal parts - half of the cell each.
The default width of the column is 80% which means that each column takes a bit less width than there is allotted to it, providing nicely spaced out columns.
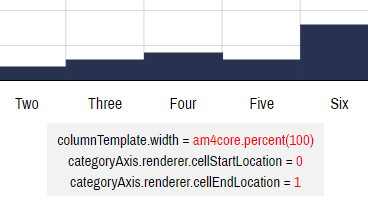
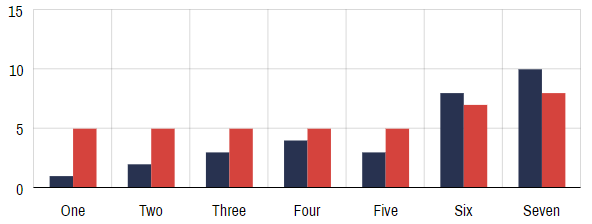
Let's see what would happen if we would bump that up to 100%.
columnTemplate.width = am4core.percent(100)Columns now extend the whole width given to them end-to-end.
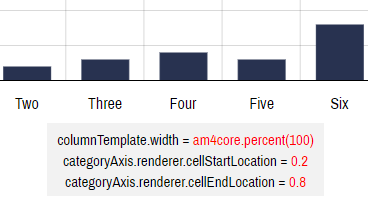
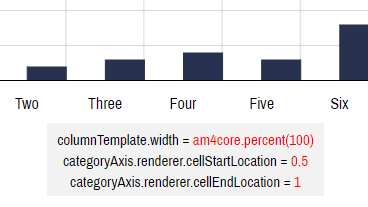
Now, if we want to give each cluster a space, all we need to do is to reduce the "cell width" using our two friends from before cellStartLocation and cellEndLocation.
columnTemplate.width = am4core.percent(100)categoryAxis.renderer.cellStartLocation = 0.2categoryAxis.renderer.cellEndLocation = 0.8Here's a live chart, should you care to play with it:
See the Pen amCharts 4: Column width (4) by amCharts (@amcharts) on CodePen.