Normally, heatmaps that use "heat rules" are restricted to two colors as well as gradient in-between. In tutorial we'll see how we can use adapters to apply any number of colors to heat map based on source value.
The task
During the course of this tutorial we'll transform the chart to color columns in series to be filled with either red, yellow, or green, based on the value.

Regular chart (no heatmap). 
Heat rules - based heatmap. 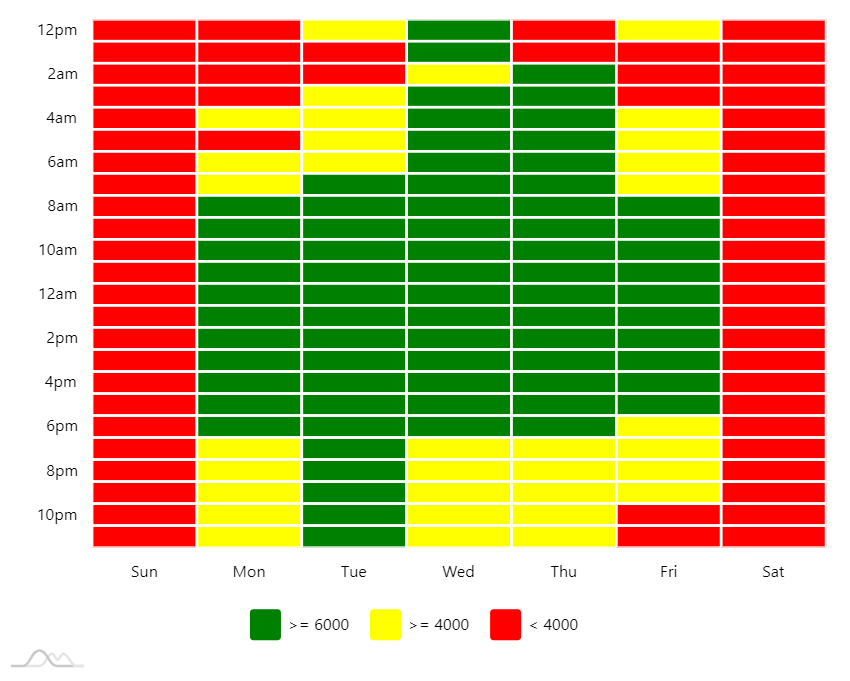
Adapter - based heatmap (our target).
Conditional fills
As we already mentioned, conventional "heat rules" are limited to two colors, so they will not do here.
We'll use adapters to determine fill color for each of the columns dynamically.
Just to recap an adapter is a custom function that value of virtually any property of the element is passed through giving it a chance to modify it. For more about adapters, read here.
series.columns.template.column.adapter.add("fill", function(fill, target) {
  if (target.dataItem) {
    if (target.dataItem.value >= 6000) {
      return am4core.color("#0f0")
    }
    else if (target.dataItem.value >= 4000) {
      return am4core.color("#ff0")
    }
    else {
      return am4core.color("#f00");
    }
  }
  return fill;
});
{
  // ...
  "series": [{
    // ...
    "columns": {
      "column": {
        "adapter": {
          "fill": function(fill, target) {
             if (target.dataItem) {
              if (target.dataItem.value >= 6000) {
                return am4core.color("#0f0")
              }
              else if (target.dataItem.value >= 4000) {
                return am4core.color("#ff0")
              }
              else {
                return am4core.color("#f00");
              }
            }
            return fill;
          }
        }
      }
    }
  }]
}
Legend
The HeatLegend which is designed for two-color heat maps will not do in this case, either.
We need three items in it, so we are going to be using conventional Legend with custom items.
let legend = new am4charts.Legend();
legend.parent = chart.chartContainer;
legend.data = {
  "name": ">= 6000",
  "fill": am4core.color("#0f0")
}, {
  "name": ">= 4000",
  "fill": am4core.color("#ff0")
}, {
  "name": "< 4000",
  "fill": am4core.color("#f00")
};
var legend = new am4charts.Legend();
legend.parent = chart.chartContainer;
legend.data = [{
  "name": ">= 6000",
  "fill": am4core.color("#0f0")
}, {
  "name": ">= 4000",
  "fill": am4core.color("#ff0")
}, {
  "name": "< 4000",
  "fill": am4core.color("#f00")
}];
{
  // ...
  "children": [{
    "type": "Legend",
    "forceCreate": true,
    "data": [{
      "name": ">= 6000",
      "fill": "#0f0"
    }, {
      "name": ">= 4000",
      "fill": "#ff0"
    }, {
      "name": "< 4000",
      "fill": "#f00"
    }]
  }]
}
Example
See the Pen amCharts 4: Three-color heat map by amCharts team (@amcharts) on CodePen.