This tutorial will show how you can add "projected circles" on the map. Projected circles respect map projection and look much more natural, as if they were "laid down" on the ground, not stuck as pins.
Regular circle
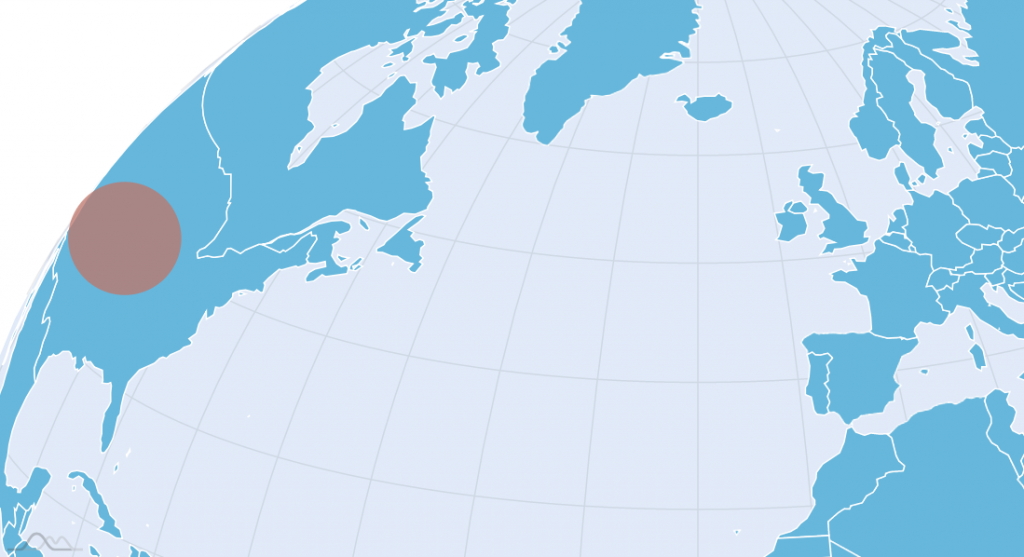
Projected circle
How to add regular images to map is covered pretty well in "Image series" section of our Map chart tutorial. During the course of this tutorial we're going to be working with projected circles, that are not circles at all, as you will see shortly.
Creating series
As with any objects on the Map Chart, we will need to create series for our circles as well.
Instinctively, we would want to use MapImageSeries - circle is an image, right?
Well, not in this case. Since we need our circles to follow the projection, we'll need them to pretend to be a polygon (well, technically it's a polygon pretending to be a circle but who's counting?) - just like any other polygon on the map.
We will also configure it as such: using mapPolygons.template:
let circleSeries = chart.series.push(new am4maps.MapPolygonSeries())
let circleTemplate = circleSeries.mapPolygons.template;
circleTemplate.fill = am4core.color("#bf7569");
circleTemplate.strokeOpacity = 0;
circleTemplate.fillOpacity = 0.75;
var circleSeries = chart.series.push(new am4maps.MapPolygonSeries())
var circleTemplate = circleSeries.mapPolygons.template;
circleTemplate.fill = am4core.color("#bf7569");
circleTemplate.strokeOpacity = 0;
circleTemplate.fillOpacity = 0.75;
{
  // ...
  "series": [{
    "type": "MapPolygonSeries"
    // ...
  }, {
    "type": "MapPolygonSeries"
    "mapPolygons": {
      "fill": "#bf7569",
      "strokeOpacity": 0,
      "fillOpacity": 0.75
    }
  }]
}
Adding circles
Adding projected circles (polygons) is a bit different than anything else we have been doing with Map Chart.
To crate geo data for such circle we are going to use a helper function am4maps.getCircle(longitude, latitude, radius).
As you can see it takes longitude/latitude coordinates as our circle's center, as well as relative radius expressed in vertical degrees (globe is 180 degrees from one pole to another).
Let's make America great again by plopping the largest pancake in country's history right in the middle of it: -97.44 (long) 38.94 (lat).
let polygon = circleSeries.mapPolygons.create();
polygon.multiPolygon = am4maps.getCircle(-97.44, 38.94, 5);
var polygon = circleSeries.mapPolygons.create();
polygon.multiPolygon = am4maps.getCircle(-97.44, 38.94, 5);
{
  // ...
  "series": [{
    "type": "MapPolygonSeries"
    // ...
  }, {
    "type": "MapPolygonSeries"
    "mapPolygons": {
      "fill": "#bf7569",
      "strokeOpacity": 0,
      "fillOpacity": 0.75
    },
    "callback": function() {
      var polygon = this.mapPolygons.create();
      polygon.multiPolygon = am4maps.getCircle(-97.44, 38.94, 5);
    }
  }]
}
That's it!
Example
See the Pen amCharts 4: projected circles tutorial by amCharts team (@amcharts) on CodePen.
Want a cooler demo using projected circles? Check this out.