If we are using Pie charts, once in a while we end up with one that has simply too many slices. This tutorial will look at some basic ways to make it less awkward.
The problem
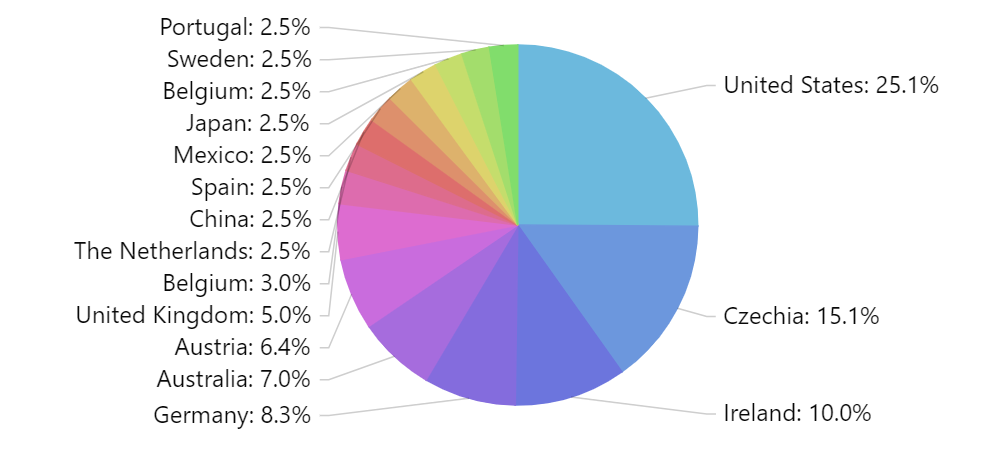
Having a lot of slices on a single chart poses an obvious issue: the labels displayed for each chart simply do not fit.

The solutions
There are a few things you could do. We'll look at them each one-by-one.
Reduce label padding
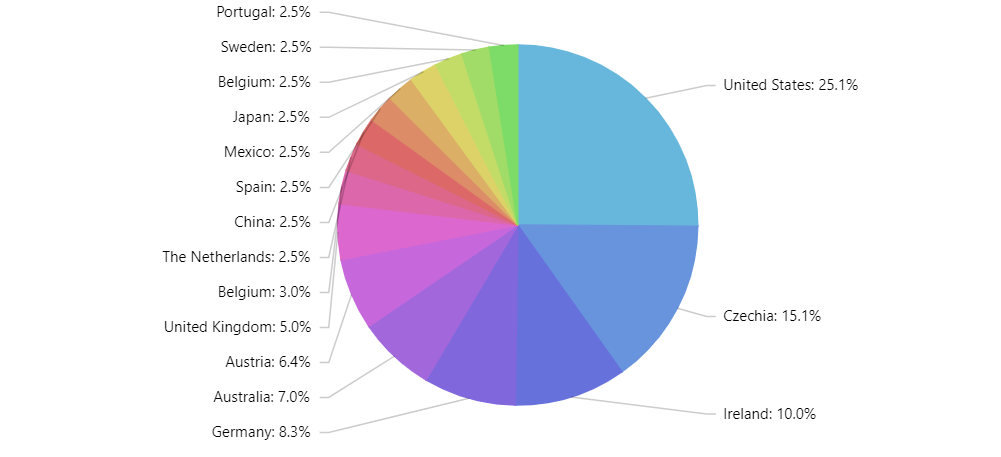
This will allow labels to be packed closer together, so more of them fit in the same column.
pieSeries.labels.template.paddingTop = 0;
pieSeries.labels.template.paddingBottom = 0;
pieSeries.labels.template.paddingTop = 0;
pieSeries.labels.template.paddingBottom = 0;
{
  // ...
  "series": [{
    // ...
    "labels": {
      "paddingTop": 0,
      "paddigBottom": 0
    }
  }]
}
Here's how our chart looks like now:
Reduce font size
Reducing font size also makes labels smaller and thus makes more of them fit into same space.
pieSeries.labels.template.fontSize = 10;
pieSeries.labels.template.fontSize = 10;
{
  // ...
  "series": [{
    // ...
    "labels": {
      "fontSize": 10
    }
  }]
}
Use SliceGrouper
SliceGrouper is a free plugin which would automatically group small slices into a single slice, which can be made to explode on click/tap.
let grouper = pieSeries.plugins.push(new am4plugins_sliceGrouper.SliceGrouper());
grouper.threshold = 5;
grouper.groupName = "Other";
grouper.clickBehavior = "zoom";
var grouper = pieSeries.plugins.push(new am4plugins_sliceGrouper.SliceGrouper());
grouper.threshold = 5;
grouper.groupName = "Other";
grouper.clickBehavior = "zoom";
 {
  // ...
  "series": [{
    // ...
    "plugins": [{
      "type": "SliceGrouper",
      "threshold": 5,
      "groupName": "Other",
      "clickBehavior": "break"
    }]
  }]
}

Grouped slices 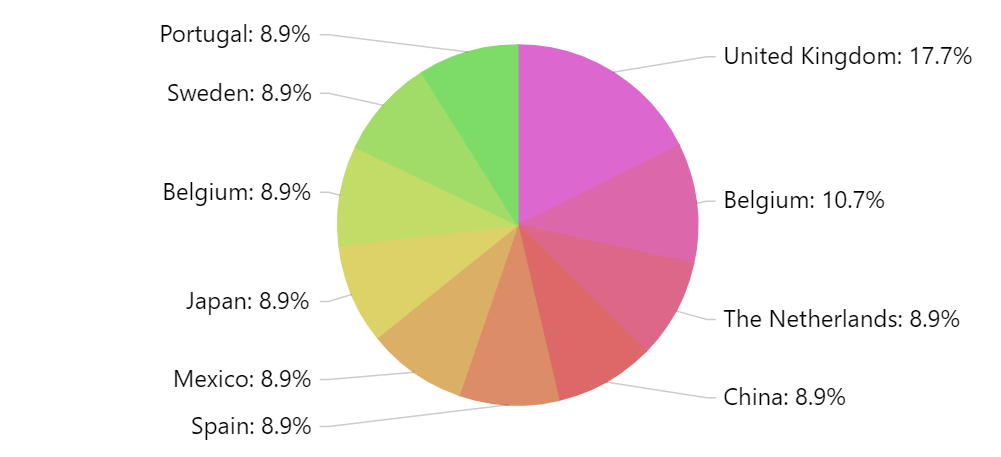
Grouped slices expanded
MORE INFO For more information about SliceGrouper plugin, read here.
And here's a live example using SliceGrouper:
See the Pen amCharts 4: Dealing with PieChart with too many slices by amCharts team (@amcharts) on CodePen.