This short tutorial will show how you can create a Globe out of your map using Orthographic projection.
Setting projection
As you may already know, each map can be displayed in a number of ways - projections. (more about it here)
Each one has it's own advantages and disadvantages. However, only one can be used to create a Globe-like representation of the world - Orthographic.
To set this projection we use map's projection property:
chart.projection = new am4maps.projections.Orthographic();
chart.projection = new am4maps.projections.Orthographic();
{
  // ...
  "projection": "Orthographic",
  // ...
}
This alone is enough to convert your regular flat map into a globe!
Setting globe rotation
Normally, the our newly created globe will have its zero longitude in the middle.
You can set the initial start position using deltaLongitude setting.
It works by adjusting the middle one way or another by longitude degrees.
chart.deltaLongitude = -60;
chart.deltaLongitude = -60;
{
  // ...
  "deltaLongitude": -60,
  // ...
}
MORE INFO You're not limited to just rotating the globe horizontally. It can be rotated in any direction. For more info refer to "Map rotation" section in our Map Chart main article.
Globe background
A globe with curved countries "in the air" looks kinda weird. To make it look more like a real globe, let's add a fill, or rather "background series".
The whole process is described in great detail in "Background series". We're just going to repeat the code here for our convenience.
chart.backgroundSeries.mapPolygons.template.polygon.fill = am4core.color("#aadaff");
chart.backgroundSeries.mapPolygons.template.polygon.fillOpacity = 1;
chart.backgroundSeries.mapPolygons.template.polygon.fill = am4core.color("#aadaff");
chart.backgroundSeries.mapPolygons.template.polygon.fillOpacity = 1;
{
  // ...
  "backgroundSeries": {
    "mapPolygons": {
      "polygon": {
        "fill": "#aadaff",
        "fillOpacity": 1
      }
    }
  }
}
Map grid
OK, just one last enhancement: map grid. It will give our map an event more "globy" effect.
Again, check out "Map grid" in main Map Chart article for a thorough guidance. We're just leave you with a TL/DR; version.
var graticuleSeries = chart.series.push(new am4maps.GraticuleSeries());
graticuleSeries.mapLines.template.line.stroke = am4core.color("#67b7dc");
graticuleSeries.mapLines.template.line.strokeOpacity = 0.2;
graticuleSeries.fitExtent = false;
var graticuleSeries = chart.series.push(new am4maps.GraticuleSeries());
graticuleSeries.mapLines.template.line.stroke = am4core.color("#67b7dc");
graticuleSeries.mapLines.template.line.strokeOpacity = 0.2;
graticuleSeries.fitExtent = false;
{
  // ...
  "series": [{
    // ...
  }, {
    "type": "GraticuleSeries",
    "zIndex": -1,
    "fitExtent": false,
    "mapLines": {
      "line": {
        "stroke": "#67b7dc",
        "strokeOpacity": 0.2
      }
    }
  }]
}
The demo
We've fitted the following demo with a slider, to see how changing deltaLongitude affects our globe:
See the Pen amCharts 4: Orthographic projection by amCharts (@amcharts) on CodePen.
User interactions
Map Chart allows configuring the globe to rotate instead of moving when using mouse or touch, using its panBehavior property.
MORE INFO For more info and examples about this feature, refer to "Interacting with map" section of our map Map Chart article.
And, here's another demo that shows rotation of the globe by dragging the map itself:
See the Pen amCharts 4: Orthographic projection (dragging) by amCharts (@amcharts) on CodePen.
Map line series
Before you go, let's talk about Map line series.
Using lines on the map in Orthographic projection presents certain challenges, because line might start and end on the "invisible" side of the globe: one's that facing away from viewer.
Images that are "out of the view" will be automatically hidden, but what about lines?
We'd expect them to be shown and be cut off when they cross the threshold of the "horizon".
The truth is that only MapLineSeries support this functionality, and only when shortestDistance = true (default setting).
Other line series like MapArcSeries and MapSplineSeries are not supported.
Consider a multi-point line that goes from Paris to Mexico City, then continues to Honolulu. This is how using different map line series will look like:
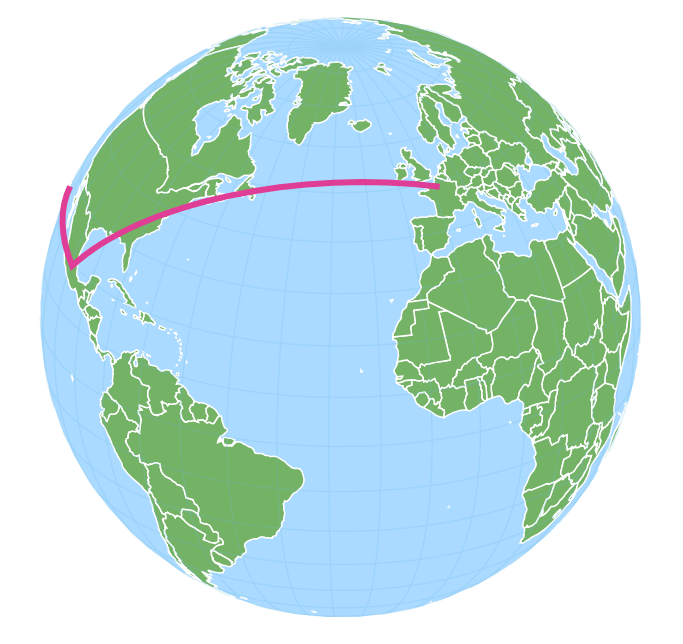
MapLineSeries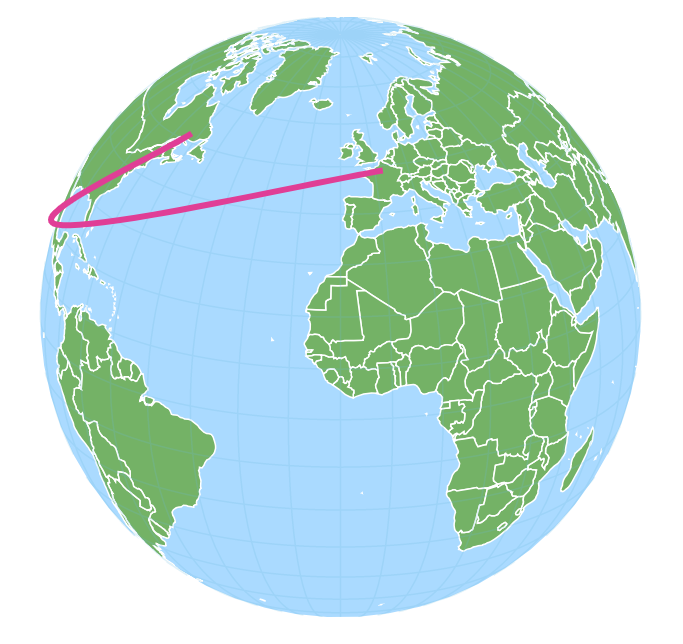
MapSplineSeries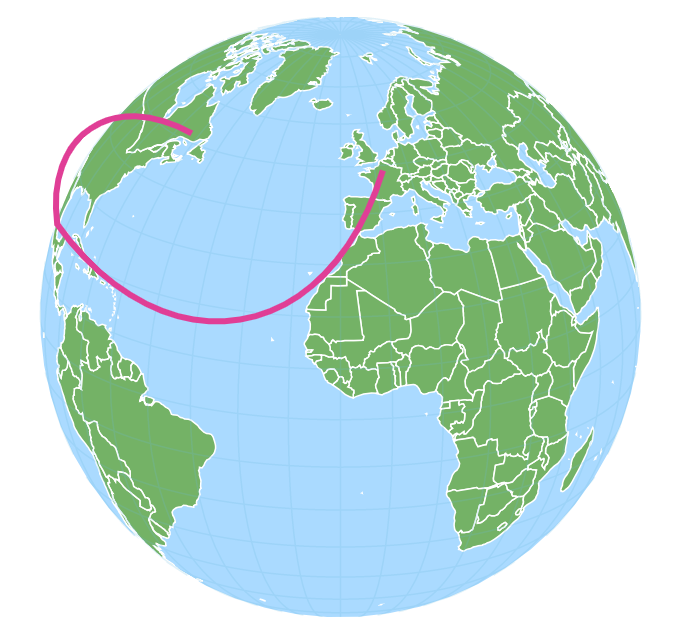
MapArcSeries
All line types produce correct result in that they reach their target coordinates. However only MapLineSeries ar being correctly cut off at the "horizon".
See the Pen amCharts 4: Orthographic projection (lines) by amCharts team (@amcharts) on CodePen.