In dynamic dashboards, sometimes there are situations where you have a no-data chart. In this case it would be nice to show some kind of placeholder, instead of an empty space.
This tutorial explains how to create such placeholder for a Pie chart.
Prerequisites
This tutorial makes use of series' "property fields", so we suggest taking a look at "Property fields" section in our Data tutorial.
Creating placeholder chart
The idea is to create a chart with a single slice with "dummy" data:
chart.data = [{
  "country": "Dummy",
  "value": 1000
}];
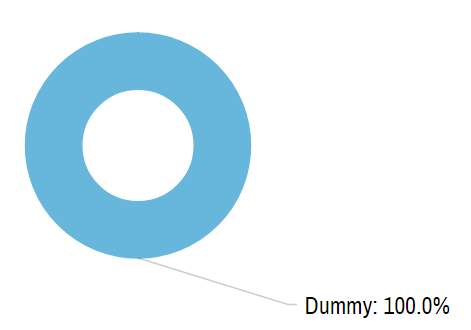
Now, if we run a chart like this, we will get a full-fledged Pie chart, with a single slice, showing labels for a "Dummy" country, which is misleading.
We need to make the dummy slice look like a placeholder: grey, dashed outline, and no labels.
We could go ahead and configure Pie series' slice template like that, like we showed in the "Pie Chart: Configuring appearance" article.
That would create one problem, though: when we replace the placeholder (dummy) data, all of the now real slices will look like placeholders. Not good.
This means we need to set appearance settings for just the dummy slice.
For that we can use "property fields" - a way to set specific properties for individual items (slices) via data.
MORE INFO Please refer to "Property fields" section in our Data tutorial.
Here's how it looks:
/* Dummy innitial data data */
chart.data = [{
  "country": "Dummy",
  "disabled": true,
  "value": 1000,
  "color": am4core.color("#dadada"),
  "opacity": 0.3,
  "strokeDasharray": "4,4",
  "tooltip": ""
}];

/* Create series */
var series = chart.series.push(new am4charts.PieSeries());
series.dataFields.value = "value";
series.dataFields.category = "country";

/* Set up slice appearance */
var slice = series.slices.template;
slice.propertyFields.fill = "color";
slice.propertyFields.fillOpacity = "opacity";
slice.propertyFields.stroke = "color";
slice.propertyFields.strokeDasharray = "strokeDasharray";
slice.propertyFields.tooltipText = "tooltip";

series.labels.template.propertyFields.disabled = "disabled";
series.ticks.template.propertyFields.disabled = "disabled";
{
  // ...
  "data": [{
    "country": "Dummy",
    "disabled": true,
    "value": 1000,
    "color": am4core.color("#dadada"),
    "opacity": 0.3,
    "strokeDasharray": "4,4",
    "tooltip": ""
  }],
  series: [{
    // ...
    "dataFields": {
      "value": "value",
      "category": "country"
    },
    "slices": {
      "propertyFields": {
        "fill": "color",
        "fillOpacity": "opacity",
        "stroke": "color",
        "strokeDasharray": "strokeDasharray",
        "tooltipText": "tooltip"
      }
    },
    "labels": {
      "propertyFields": {
        "disabled": "disabled"
      }
    },
    "ticks": {
      "propertyFields": {
        "disabled": "disabled"
      }
    }
  }]
}
As you can see, we're using slices list template to configure property fields for how our placeholder slice looks like, as well as labels and ticks list templates' to set property fields to disable them via data.
Now, this looks like a real placeholder, no one would mistake for real data:

Will those property fields affect the real slices when we replace dummy data with the real one? - you might ask.
The answer is no - they won't because the real data does not have not values for those fields, so they will be ignored.
Hiding dummy slice from legend
If your chart has a legend, you might want to hide your dummy slice from it.
To make a slice not appear in legend, we can use "hiddenInLegend" in Pie series' dataFields. (notice it's not propertyFields)
series.dataFields.hiddenInLegend = "disabled";
series.dataFields.hiddenInLegend = "disabled";
{
  // ...
  series: [{
    // ...
    "dataFields": {
      "value": "value",
      "category": "country",
      "hiddenInLegend": "disabled"
    },
    // ...
  }]
}
Replacing with real data
To replace our placeholder with real data, all we have to do is to set chart's data property with a new array.
We might also want to briefly hide and show the Pie series so whatever we have set up for animations is triggered again, for a nice effect.
function addData() {
  chart.data = data;
  series.hide(0);
  series.show();
}
function addData() {
  chart.data = data;
  series.hide(0);
  series.show();
}
Working example
See the Pen amCharts 4: Showing placeholder for empty Pie chart by amCharts (@amcharts) on CodePen.