Our Map Chart allows zooming directly to a specific polygon (country). However, for some countries, automatically-calculated zoom settings might not cut it. This tutorial will explain how you can use Polygon series data to override default zoom settings with custom ones.
The problem
We can make the chart zoom to a specific country using zoomToMapObject() method. We're not going to get into detail here, as it is described thoroughly in "Pre-zooming Map to a Country" tutorial.
The said zoom method works by measuring coordinates for all four extremes for the selected polygon, then choosing a latitude/longitude that represents geometrical center. It also calculates zoom level in such ways, that when zoomed to, the polygon would be centered to and fits perfectly into the viewport.
That works perfectly fine for most countries, states, and other subdivisions.
The key word here is "most". Which means not all.
Some countries go beyond the -180/180 longitude threshold, so parts of them are "cut off" and moved to the other "side" of the map.
The most notable example is Russia with the tip of its Siberian territory jumping to "left":
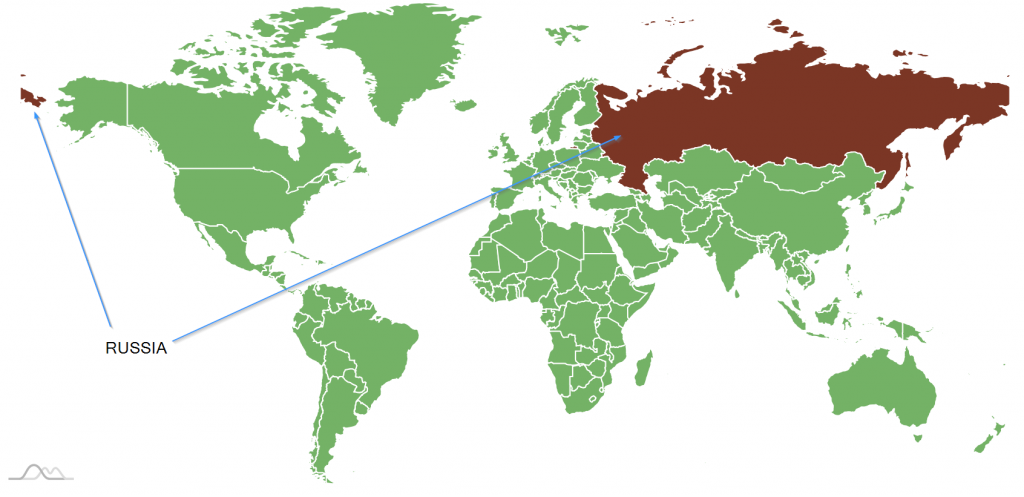
Now, when zoomToMapObeject() tries to zoom, it operates out of the assumption that the most West-ward longitude is -180 while East-ward one is 180.
While technically correct, it does not act the way a human would expect it to.
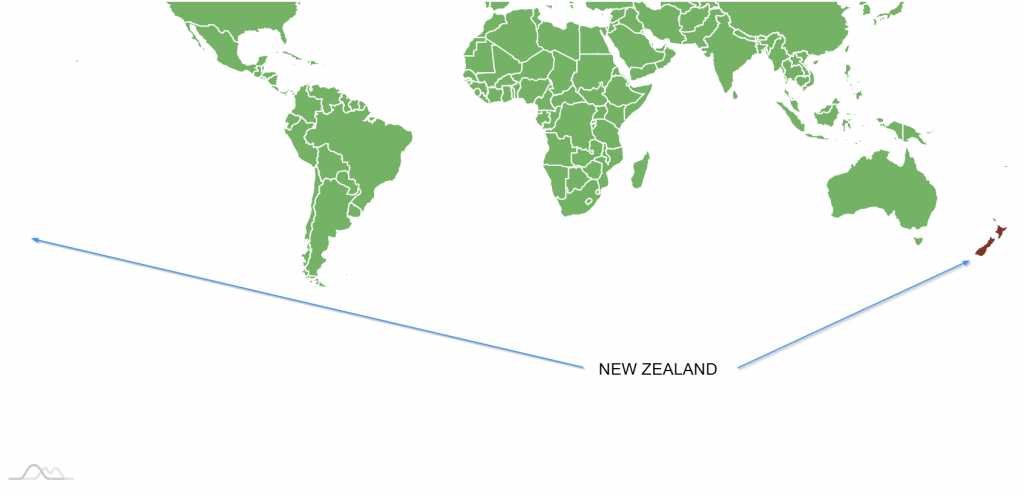
Russia is not the only country affected by it. There are less prominent examples, like New Zealand, which on our high-detail map, has some islands beyond the longitude wrap point.
The solution
Presently, the only solution for this is to use manual zoom coordinates for these countries.
Luckily, we can add those into data and bind them using data fields.
"Data fields" is a way to specify which series items' properties correspond to which fields in series' data. If set, zoomToMapObject() will use those settings in place of the automatically-calculated ones.
Let's see how that looks code-wise.
polygonSeries.data = [{
   "id": "NZ",
   "zoomLevel": 12,
   "zoomGeoPoint": {
     "latitude": -41,
     "longitude": 173
   }
 }, {
   "id": "RU",
   "zoomLevel": 2.5,
   "zoomGeoPoint": {
     "latitude": 62,
     "longitude": 96
   }
 }];

 polygonSeries.dataFields.zoomLevel = "zoomLevel";
 polygonSeries.dataFields.zoomGeoPoint = "zoomGeoPoint";
{
  // ...
  "series": [{
    "type": "MapPolygonSeries",
    // ...
    "dataFields": {
      "zoomLevel": "zoomLevel",
      "zoomGeoPoint": "zoomGeoPoint
    },
    [{
      "id": "NZ",
      "zoomLevel": 12,
      "zoomGeoPoint": {
        "latitude": -41,
        "longitude": 173
      }
    }, {
      "id": "RU",
      "zoomLevel": 2.5,
      "zoomGeoPoint": {
        "latitude": 62,
        "longitude": 96
      }
    }]
  }]
}
Now when we zoom to either Russia or New Zealand, the map will use custom coordinates instead of automatically-calculated ones.
See the Pen amCharts 4: Custom zoom positions via dataFields by amCharts team (@amcharts) on CodePen.