Its easy to consolidate a lot of data into a single tooltip that is displayed over Series using Cursor. We've covered it in this tutorial. But what if we don't want a huge square following our cursor, and would rather display that info in a fixed place in the corner? Read on, as we show you how.
The task
Let's take this rather simplistic Candlestick chart:
See the Pen amCharts 4: static hover info tooltip by amCharts team (@amcharts) on CodePen.
We have its series set up with a tooltipText so that all kinds of info is displayed in a mobile tooltip when you hover the chart:
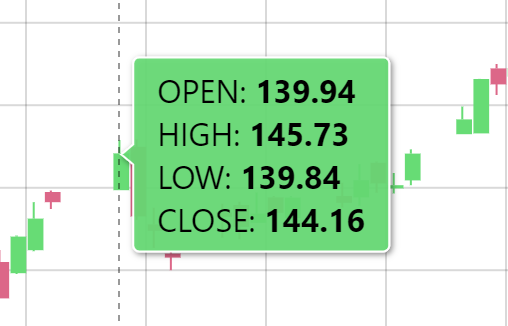
What we would rather have is some non-intrusive block of information, somewhere in the corner of the chart, that would shown the same information when we glide our cursor across the chart.
Let's see how we can achieve that.
Disabling tooltips
The action of disabling tooltips basically consists of not enabling them in the first place.
So, to disable tooltips from the example above, we just need to remove the tooltipText setting from our series. Done.
Creating an info block
As a first step, let's create a container with placeholder labels for our data.
Container
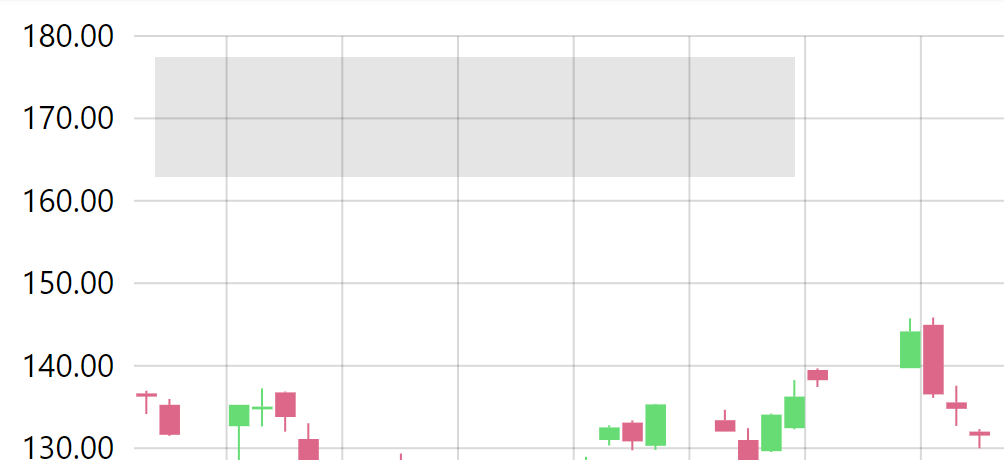
We want out data to be in the corner of the plot area, so we will create a new Container as a child in chart's plotContainer.
We'll size, position it, set its layout type, and configure background to be semi-transparent gray:
let info = chart.plotContainer.createChild(am4core.Container);
info.width = 320;
info.height = 60;
info.x = 10;
info.y = 10;
info.padding(10, 10, 10, 10);
info.background.fill = am4core.color("#000");
info.background.fillOpacity = 0.1;
info.layout = "grid";
var info = chart.plotContainer.createChild(am4core.Container);
info.width = 320;
info.height = 60;
info.x = 10;
info.y = 10;
info.padding(10, 10, 10, 10);
info.background.fill = am4core.color("#000");
info.background.fillOpacity = 0.1;
info.layout = "grid";
{
  // …
  "plotContainer": {
    "children": [{
      "type": "Container"
      "width": 320,
      "height": 60,
      "x": 10,
      "y": 10,
      "layout": "grid",
      "paddingTop": 10,
      "paddingRight": 10,
      "paddingBottom": 10,
      "paddingLeft": 10,
      "background": {
        "fill": "#000",
        "fillOpacity": 0.1
      }
    }]
  }
}
Notice how we set layout to "grid". This will ensure that we won't have to worry about placement of labels. They will automatically be arranged into a grid.
MORE INFO For more information on how layouts work in amCharts 4, check our "Working with containers" article.
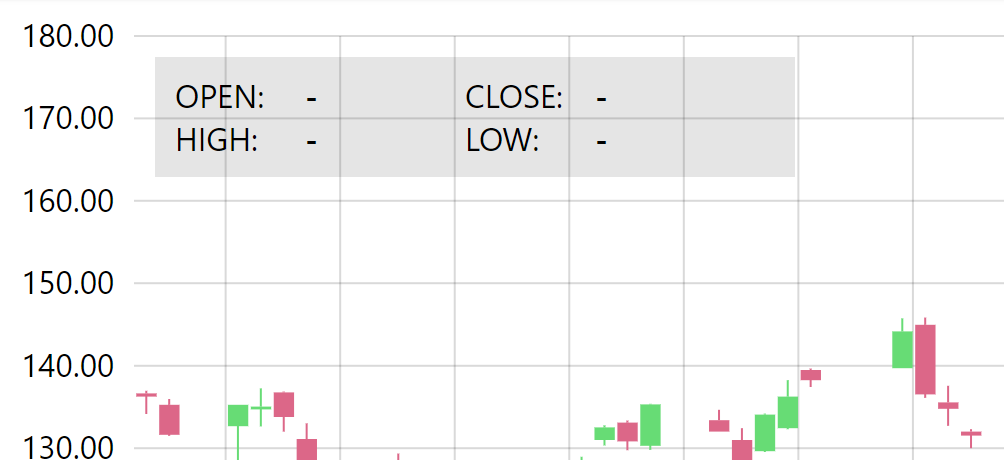
Label placeholders
Now, let's add Label elements for open, high, low, and close values.
Since we will be creating a lot of labels, let's whip a function to automate that for us. (If you are using JSON config, this will work a bit differently)
function createLabel(field, title) {
  let titleLabel = info.createChild(am4core.Label);
  titleLabel.text = title + ":";
  titleLabel.marginRight = 5;
  titleLabel.minWidth = 60;

  let valueLabel = info.createChild(am4core.Label);
  valueLabel.id = field;
  valueLabel.text = "-";
  valueLabel.minWidth = 50;
  valueLabel.marginRight = 30;
  valueLabel.fontWeight = "bolder";
}

createLabel("open", "OPEN");
createLabel("close", "CLOSE");
createLabel("high", "HIGH");
createLabel("low", "LOW");
function createLabel(field, title) {
  var titleLabel = info.createChild(am4core.Label);
  titleLabel.text = title + ":";
  titleLabel.marginRight = 5;
  titleLabel.minWidth = 60;

  var valueLabel = info.createChild(am4core.Label);
  valueLabel.id = field;
  valueLabel.text = "-";
  valueLabel.minWidth = 50;
  valueLabel.marginRight = 30;
  valueLabel.fontWeight = "bolder";
}

createLabel("open", "OPEN");
createLabel("close", "CLOSE");
createLabel("high", "HIGH");
createLabel("low", "LOW");
{
  // …
  "plotContainer": {
    "children": [{
      "type": "Container"
      // …
      "children": [{
        "type": "Label",
        "text": "OPEN",
        "marginRight": 5,
        "minWidth": 60
      }, {
        "type": "Label",
        "id": "open",
        "text": "-",
        "marginRight": 30,
        "minWidth": 50,
        "fontWeight": "bolder"
      }, {
        "type": "Label",
        "text": "CLOSE",
        "marginRight": 5,
        "minWidth": 60
      }, {
        "type": "Label",
        "id": "close",
        "text": "-",
        "marginRight": 30,
        "minWidth": 50,
        "fontWeight": "bolder"
      }, {
        "type": "Label",
        "text": "HIGH",
        "marginRight": 5,
        "minWidth": 60
      }, {
        "type": "Label",
        "id": "high",
        "text": "-",
        "marginRight": 30,
        "minWidth": 50,
        "fontWeight": "bolder"
      }, {
        "type": "Label",
        "text": "LOW",
        "marginRight": 5,
        "minWidth": 60
      }, {
        "type": "Label",
        "id": "low",
        "text": "-",
        "marginRight": 30,
        "minWidth": 50,
        "fontWeight": "bolder"
      }]
    }]
  }
}
Notice how we set id for our value labels. We'll need those to reference them when we'll be updating them with actual values.
OK, let's see how we're doing so far.
Setting values
There will be three occasions where we will want to updated values:
- When chart first loads
- When we move cursor across chart
- When we move cursor outside the chart
For the first and last occasion we want to display "close" value, or basically the value of the last data point in data.
For the second one, we'll display data related to the data point currently being hovered.
Let's create a universal function to handle all that updating.
function updateValues(dataItem) {
  am4core.array.each(["open", "close", "high", "low"], function(key) {
    let series = chart.series.getIndex(0);
    let label = chart.map.getKey(key);
    label.text = chart.numberFormatter.format(dataItem[key + "ValueY"]);
  });
}
function updateValues(dataItem) {
  am4core.array.each(["open", "close", "high", "low"], function(key) {
    var series = chart.series.getIndex(0);
    var label = chart.map.getKey(key);
    label.text = chart.numberFormatter.format(dataItem[key + "ValueY"]);
  });
}
NOTE In previous sections we mentioned setting id of the value labels. That's where it comes in to become useful. We now can universally access those objects by their ID using chart.map.getKey(id) method.
The function accepts a data item for which to populate labels with.
Setting initial values
Let's use chart's ready event to grab the last data item from our Series, and pass it to updateValues() function.
chart.events.on("ready", function(ev) {
  updateValues(series.dataItems.last);
});
chart.events.on("ready", function(ev) {
  updateValues(series.dataItems.last);
});
{
  // ...
  "events": {
    "ready": function(ev) {
      var series = ev.baseSprite.series.getIndex(0);
      updateValues(series.dataItems.last);
    }
  }
}
Let's see how that works:
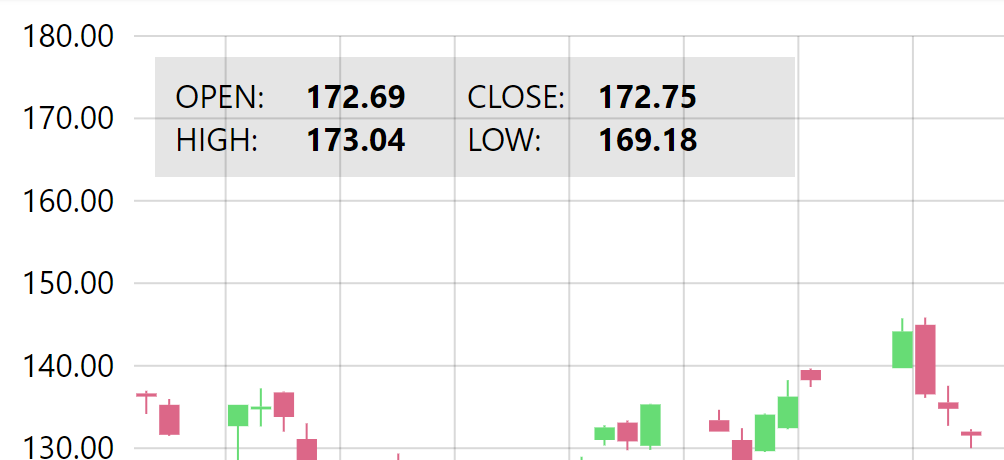
Perfect.
Setting context values
Now, let's see how we can update it to context-sensitive values that will reflect data point the cursor is positioned over.
For that, we'll need to track cursor's position using its cursorpositionchanged event.
chart.cursor.events.on("cursorpositionchanged", function(ev) {
  let dataItem = dateAxis.getSeriesDataItem(
    series,
    dateAxis.toAxisPosition(chart.cursor.xPosition),
    true
  );
  updateValues(dataItem);
});
chart.cursor.events.on("cursorpositionchanged", function(ev) {
  var dataItem = dateAxis.getSeriesDataItem(
    series,
    dateAxis.toAxisPosition(chart.cursor.xPosition),
    true
  );
  updateValues(dataItem);
});
{
  // …
  "cursor": {
    // …
    "events": {
      "cursorpositionchanged": function(ev) {
        var dateAxis = ev.baseSprite.xAxes.getIndex(0);
        var cursor = ev.target;
        var series = ev.baseSprite.series.getIndex(0);
        var dataItem = dateAxis.getSeriesDataItem(
          series,
          dateAxis.toAxisPosition(cursor.xPosition),
          true
        );
        updateValues(dataItem);
      }
    }
  }
}
As you can see, this is a bit more complicated, since we need to translate Cursor's X position into an actual data item that corresponds it.
After that, it's easy street. We just toss it to our updateValues() function and let it do its magic.
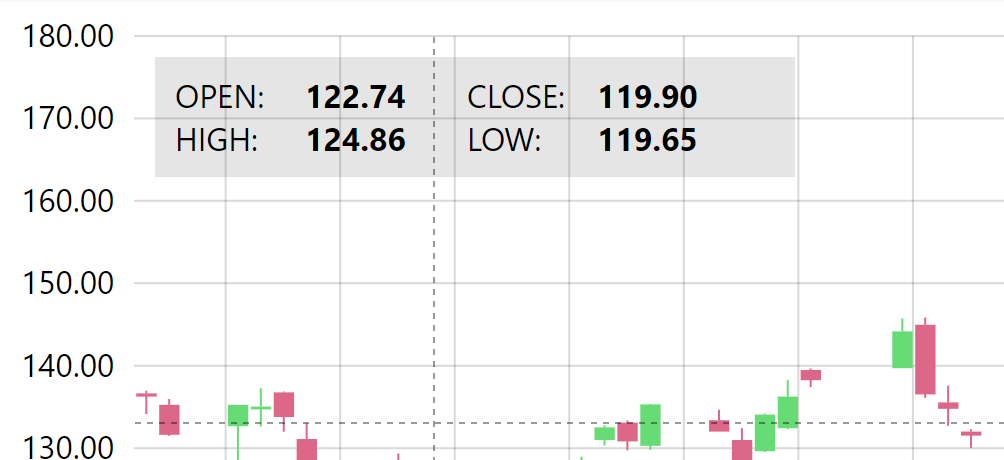
Now as we move cursor across the chart, our values get dynamically updated:
Resetting back to close values when cursor moves outside the chart
We just have one last contingency to cover: reset our values to the closing data point when cursor moves outside chart area.
Since cursor is hidden when that happens, its hidden event will be perfect:
chart.cursor.events.on("hidden", function(ev) {
  updateValues(series.dataItems.last);
});
chart.cursor.events.on("hidden", function(ev) {
  updateValues(series.dataItems.last);
});
{
  // …
  "cursor": {
    // …
    "events": {
      // …
      "hidden": function(ev) {
        var series = ev.baseSprite.series.getIndex(0);
        updateValues(series.dataItems.last);
      }
    }
  }
}
Applying label colors
Before we wrap up and show you the final working chart, let's mod our label updating function to also set appropriate color which indicate whether value increased or decreased during the course of the hovered data item.
MORE INFO For more information on how coloring works on a Candlestick Series, please check our "Taming Candlestick Series" tutorial.
function updateValues(dataItem) {
  am4core.array.each(["open", "close", "high", "low"], function(key) {
    let series = chart.series.getIndex(0);
    let label = chart.map.getKey(key);
    label.text = chart.numberFormatter.format(dataItem[key + "ValueY"]);
    if (dataItem.droppedFromOpen) {
      label.fill = series.dropFromOpenState.properties.fill;
    }
    else {
      label.fill = series.riseFromOpenState.properties.fill;
    }
  });
}
function updateValues(dataItem) {
  am4core.array.each(["open", "close", "high", "low"], function(key) {
    var series = chart.series.getIndex(0);
    var label = chart.map.getKey(key);
    label.text = chart.numberFormatter.format(dataItem[key + "ValueY"]);
    if (dataItem.droppedFromOpen) {
      label.fill = series.dropFromOpenState.properties.fill;
    }
    else {
      label.fill = series.riseFromOpenState.properties.fill;
    }
  });
}
See how we leverage droppedFromOpen property of the data item, and Series' states to apply appropriate colors.
Let's see how that last change influences our info block:
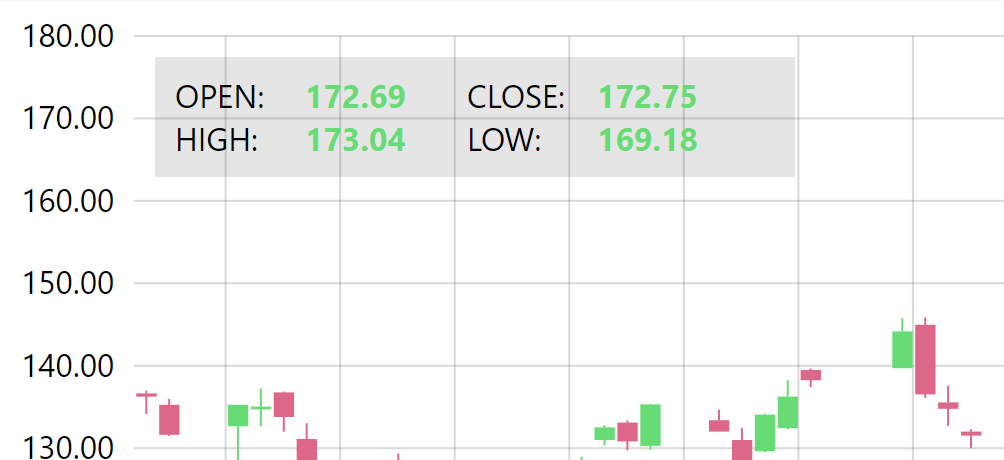
Final chart
See the Pen amCharts 4: static hover info tooltip by amCharts team (@amcharts) on CodePen.
Other uses
So far we've shown how this can be used to display multiple values from a Candlestick Series.
It's not limited to that. Since it's completely custom, your imagination is the limit how you can use it.
Here's another example that displays values from multiple Line Series.
See the Pen amCharts 4: static hover info tooltip (multiseries) by amCharts team (@amcharts) on CodePen.