This tutorial will explain how you can easily make your chart grow or contract based on an actual number of data.
The problem
Let's take a simple bar chart:
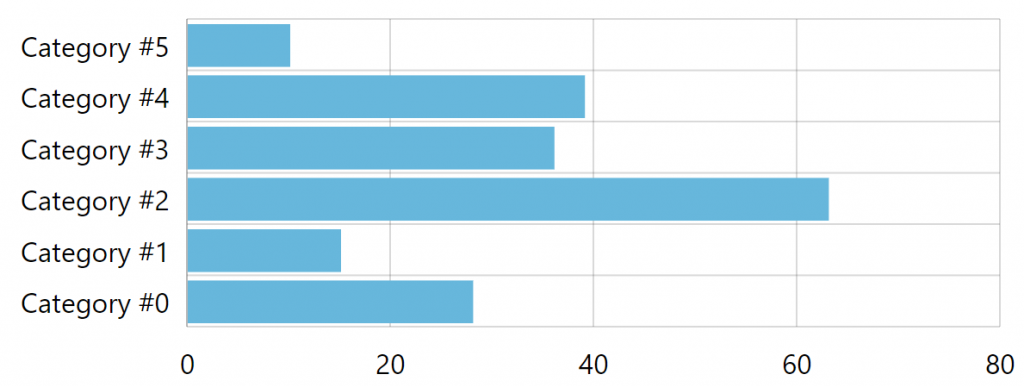
It looks OK.
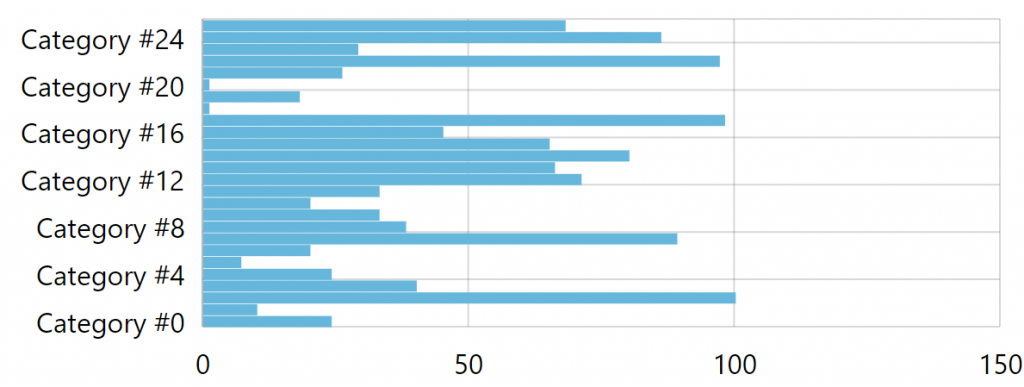
However, it height is fixed, so if we had more bars, it might start looking a bit awkward:
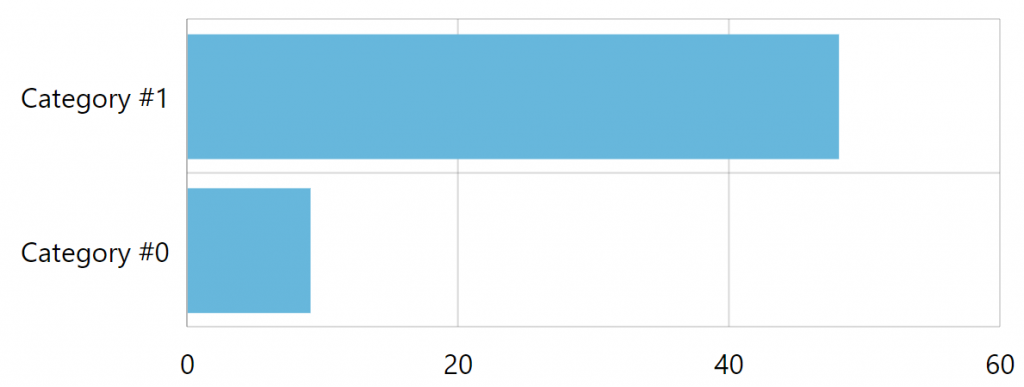
Or, if there are too few, we end up with huge bars wasting up space:
This is happening because the category axis will always try to adjust size of the bars for a better fit.
However, we can't always anticipate number of bars in our data, and therefore cannot hardcode the height of the chart container.
The solution
An obvious solution is to have chart container auto-adjust its height.
We will do that by utilizing series' "datavalidated" event, which kicks in at the moment it has finished processing its data.
At that moment we already know precisely how many bars we have, so we can calculate our target height for the chart container.
let cellSize = 30;
series.events.on("datavalidated", function(ev) {

  let series = ev.target;
  let chart = series.chart;
  let xAxis = chart.xAxes.getIndex(0);

  // Calculate how we need to adjust chart height
  let chartHeight = series.data.length * cellSize + xAxis.height() + chart.get("paddingTop", 0) + chart.get("paddingBottom", 0);

  // Set it on chart's container
  chart.root.dom.style.height = chartHeight + "px";
});
var cellSize = 30;
series.events.on("datavalidated", function(ev) {

  var series = ev.target;
  var chart = series.chart;
  var xAxis = chart.xAxes.getIndex(0);

  // Calculate how we need to adjust chart height
  var chartHeight = series.data.length * cellSize + xAxis.height() + chart.get("paddingTop", 0) + chart.get("paddingBottom", 0);

  // Set it on chart's container
  chart.root.dom.style.height = chartHeight + "px";
});
See the Pen Untitled by amCharts team (@amcharts) on CodePen.