In some cases we will come across chart setups that will have their slice labels cut off, especially on smaller charts. This tutorial will look at few ways to handle those situations.
The problem
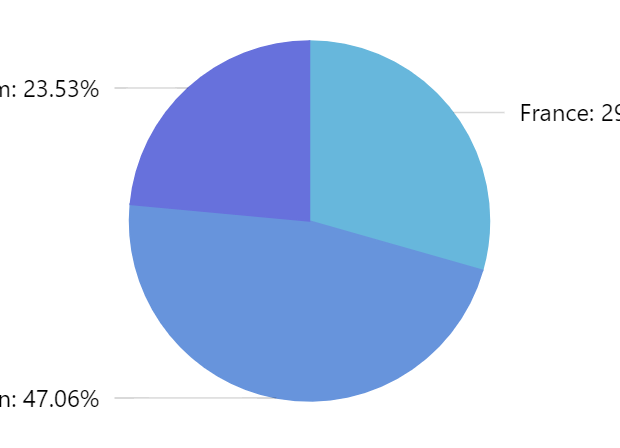
Pie chart does not factor in width of slice labels when sizing the pie itself. This means that on some smaller charts, with longer labels they might not fit and will be cut off, or completely invisible.
Possible solutions
Wrap or truncate labels
We can specify maximum width of the labels as well as what to do with such labels: wrap to multiple lines, or truncate them with an ellipsis.
series.labels.template.setAll({
  maxWidth: 150,
  oversizedBehavior: "wrap" // to truncate labels, use "truncate"
});
series.labels.template.setAll({
  maxWidth: 150,
  oversizedBehavior: "wrap" // to truncate labels, use "truncate"
});
Reduce font size
Reducing font size is another option:
series.labels.template.setAll({
  fontSize: 10
});
series.labels.template.setAll({
  maxWidth: 150,
  fontSize: 10
});
Reduce pie radius
Reducing pie radius (default: 80%) will leave more space for labels:
let chart = root.container.children.push(
  am5percent.PieChart.new(root, {
    radius: am5.percent(70)
  })
);
var chart = root.container.children.push(
  am5percent.PieChart.new(root, {
    radius: am5.percent(70)
  })
);
Change label content
Labels will display both category and percent value by default.
If some of that information is not critical, we may reduce the width of the labels further by including only relevant information:
series.labels.template.setAll({
  text: "{category}"
});
series.labels.template.setAll({
  text: "{category}"
});
NOTEMore information.
Un-align labels
Labels are aligned into two columns by default.
We can disable that so label is drawn as close to the slice as possible:
let series = chart.series.push(
  am5percent.PieSeries.new(root, {
    categoryField: "country",
    valueField: "sales",
    alignLabels: false
  })
);
var series = chart.series.push(
  am5percent.PieSeries.new(root, {
    categoryField: "country",
    valueField: "sales",
    alignLabels: false
  })
);
NOTEMore information.
Labels inside slice
We can also put labels inside slice.
Since we don't need extra space for labels, we can make the pit take up the whole area of the chart, too.
let chart = root.container.children.push(
  am5percent.PieChart.new(root, {
    radius: am5.percent(100)
  })
);

// ...

series.labels.template.setAll({
  radius: 10,
  inside: true
});
var chart = root.container.children.push(
  am5percent.PieChart.new(root, {
    radius: am5.percent(100)
  })
);

// ...

series.labels.template.setAll({
  radius: 10,
  inside: true
});
NOTEMore information.
Hide labels/ticks for small slices
series.labels.template.adapters.add("y", function(y, target) {
  let dataItem = target.dataItem;
  if (dataItem) {
    let tick = dataItem.get("tick");
    if (tick) {
      if (dataItem.get("valuePercentTotal") < 1) {
        target.set("forceHidden", true);
        tick.set("forceHidden", true);
      }
      else {
        target.set("forceHidden", false);
        tick.set("forceHidden", false);
      }
    }
    return y;
  }
});
series.labels.template.adapters.add("y", function(y, target) {
  var dataItem = target.dataItem;
  if (dataItem) {
    var tick = dataItem.get("tick");
    if (tick) {
      if (dataItem.get("valuePercentTotal") < 1) {
        target.set("forceHidden", true);
        tick.set("forceHidden", true);
      }
      else {
        target.set("forceHidden", false);
        tick.set("forceHidden", false);
      }
    }
    return y;
  }
});
See the Pen Pie Chart by amCharts team (@amcharts) on CodePen.
Hide ticks for off-chart labels
We can also use an adapter to automatically hide ticks for labels that area outside the chart area:
series.labels.template.adapters.add("y", function(y, target) {
  let dataItem = target.dataItem;
  if (dataItem) {
    var tick = dataItem.get("tick");
    if (tick) {
      if (y < -chart.height() / 2) {
        tick.set("forceHidden", true);

      }
      else {
        tick.set("forceHidden", false);
      }
    }
    return y;
  }
});
series.labels.template.adapters.add("y", function(y, target) {
  var dataItem = target.dataItem;
  if (dataItem) {
    var tick = dataItem.get("tick");
    if (tick) {
      if (y < -chart.height() / 2) {
        tick.set("forceHidden", true);

      }
      else {
        tick.set("forceHidden", false);
      }
    }
    return y;
  }
});
See the Pen Pie Chart by amCharts team (@amcharts) on CodePen.
Use responsive theme
By using a responsive theme, we can set up labels to be reduced in size, their contents changed, or completely hidden at certain chart width/height.
For more information, check out "Responsive" tutorial.