This tutorial will show how we can easily add some labels inside a donut chart to display complementing information, such as sum of values for all the slices.
Adding a label
Most of the elements in amCharts 5 is a Container, meaning it can contain other elements.
Chart itself is a container. Series is a container. Legend is a container.
To add a label all we need to do is to add a Label instance.
For our specific purpose, we are going to add a Label to series. We'll explain why in due course.
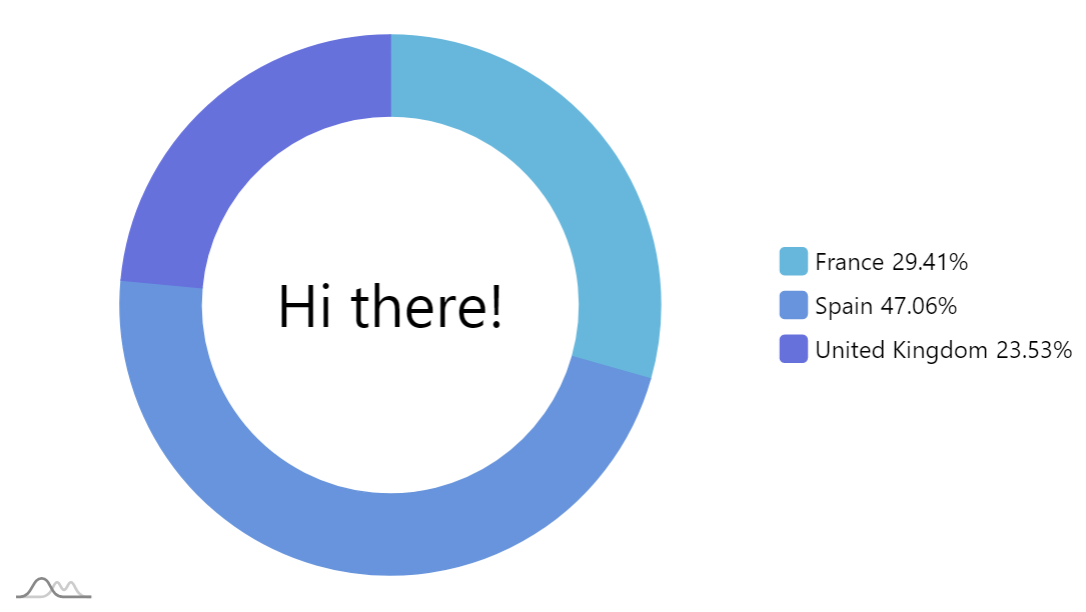
let label = series.children.push(am5.Label.new(root, {
  text: "Hi there!",
  fontSize: 40,
  centerX: am5.percent(50),
  centerY: am5.percent(50)
}));
var label = series.children.push(am5.Label.new(root, {
  text: "Hi there!",
  fontSize: 40,
  centerX: am5.percent(50),
  centerY: am5.percent(50)
}));
Notice how we're setting the centerX and centerY of our label: we do want it to be placed perfectly aligned to the middle.
Binding to data
Now, let's bind the label contents to actual data.
That's where our decision to create label as a child to series comes into play: we can use data placeholders to access actual data from series.
In our case we can use {valueSum} to access sum of slice values, held in series' private (read-only) settings:
let label = series.children.push(am5.Label.new(root, {
  text: "${valueSum}",
  fontSize: 40,
  centerX: am5.percent(50),
  centerY: am5.percent(50),
  populateText: true
}));
var label = series.children.push(am5.Label.new(root, {
  text: "${valueSum}",
  fontSize: 40,
  centerX: am5.percent(50),
  centerY: am5.percent(50),
  populateText: true
}));
Please note the populateText: true setting in the configuration of the label. Without it, data placeholders are not populated.
MORE INFO For more on inserting data placeholders, as well as in-line formatting of string label, refer to "Formatters" tutorial.
Fitting the label
One last step is to make sure the label fits.
We'll use label's setting oversizedBehavior as well as an event to dynamically apply its maxWidth to the actual available space, so it resizes when the whole series does.
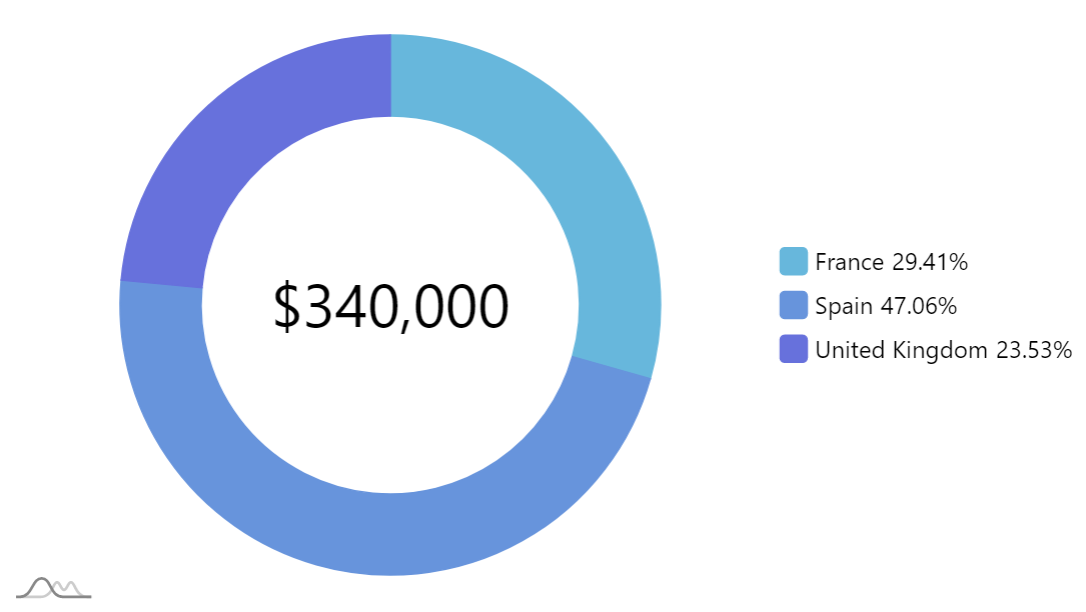
let label = series.children.push(am5.Label.new(root, {
  text: "${valueSum.formatNumber('#,###.')}",
  fontSize: 40,
  centerX: am5.percent(50),
  centerY: am5.percent(50),
  populateText: true,
  oversizedBehavior: "fit"
}));

series.onPrivate("width", function(width) {
  label.set("maxWidth", width * 0.7);
});
var label = series.children.push(am5.Label.new(root, {
  text: "${valueSum.formatNumber('#,###.')}",
  fontSize: 40,
  centerX: am5.percent(50),
  centerY: am5.percent(50),
  populateText: true,
  oversizedBehavior: "fit"
}));

series.onPrivate("width", function(width) {
  label.set("maxWidth", width * 0.7);
});
Working example
See the Pen amCharts 5: Donut chart with sum in the middle by amCharts team (@amcharts) on CodePen.