This tutorial looks at what options we have to create smoothed line and area series.
Creating smoothed line series
amCharts 5 offers types of smoothed line series:
| Class | Comment |
|---|---|
am5xy.SmoothedXLineSeries | Used for horizontal series. |
am5xy.SmoothedYLineSeries | Used for vertical series. |
am5xy.SmoothedXYLineSeries | Used for scenarios where series does not have any specific direct, e.g. scatter chart. |
Using proper axis type ensures that the line itself will not go outside its value bounds.
let series = chart.series.push(
  am5xy.SmoothedXLineSeries.new(root, {
    name: "Series",
    xAxis: xAxis,
    yAxis: yAxis,
    valueYField: "value",
    valueXField: "date"
  })
);
var series = chart.series.push(
  am5xy.SmoothedXLineSeries.new(root, {
    name: "Series",
    xAxis: xAxis,
    yAxis: yAxis,
    valueYField: "value",
    valueXField: "date"
  })
);
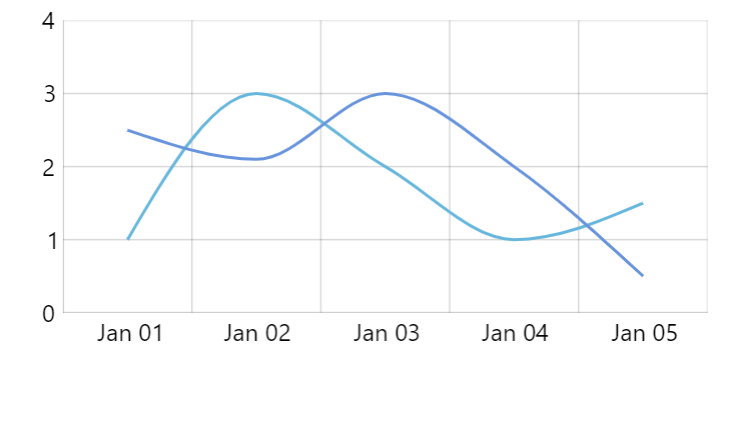
SmoothedXSeries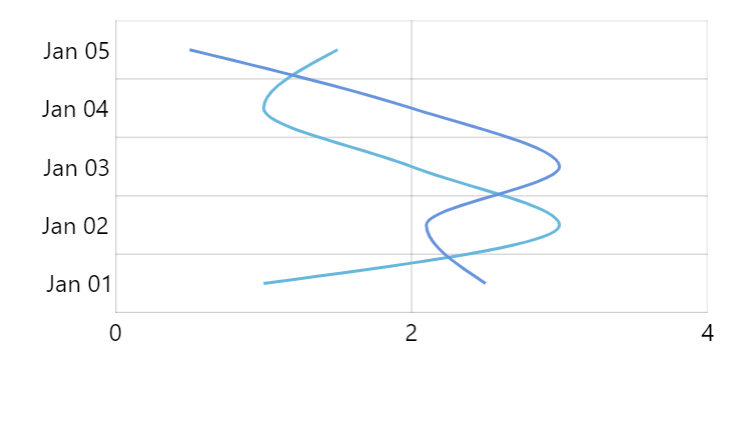
SmoothedYSeries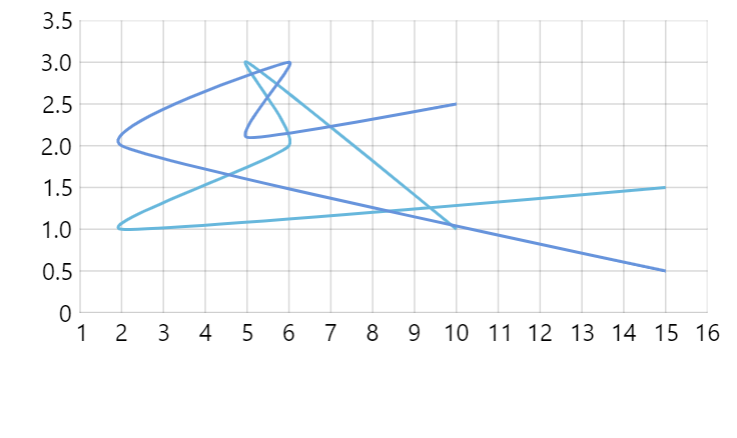
SmoothedXYSeriesSee the Pen Monotone series by amCharts team (@amcharts) on CodePen.
Line tension
Smoothed lines do have one setting: tension.
It's a numeric value from 0 (zero) to 1 (one) indicating strength the two connected points are "pulling" at the connecting line.
The smaller the number, the more lose and curvy the line will be. 1 indicates maximum strength which means it will be a perfectly straight line.
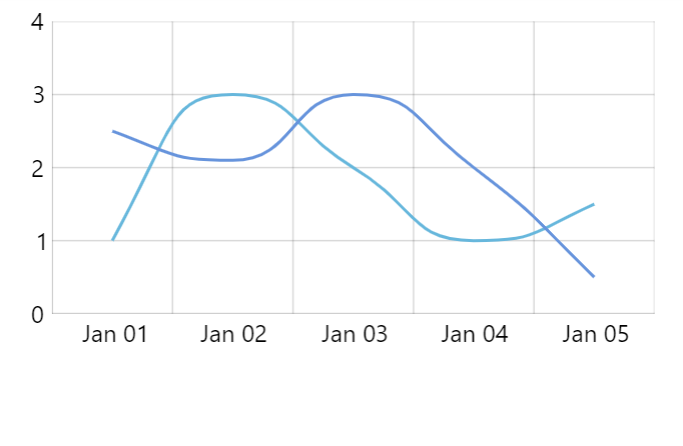
tension: 0.2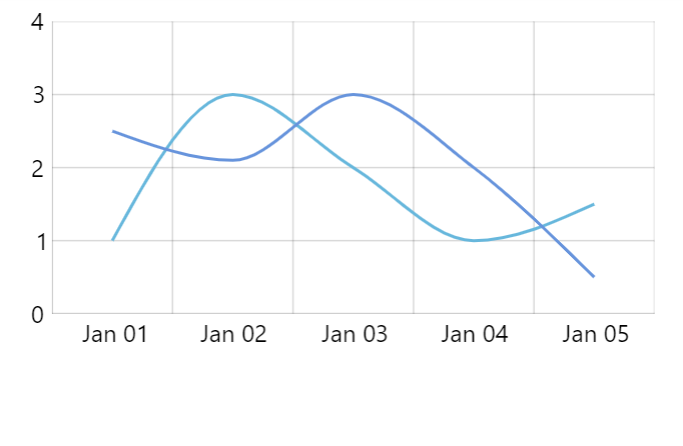
tension: 0.5 (default)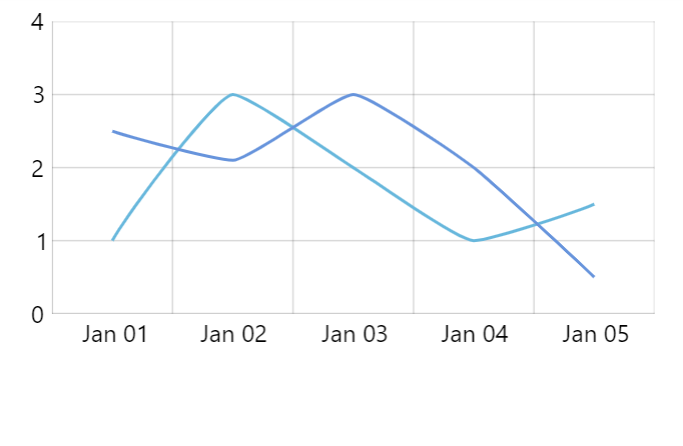
tension: 0.8Configuring appearance
By all intents and purposes all smoothed line series types are essentially a line series. Its appearance, just like line series, is configured via strokes.template and fills.template.
For more information, please refer to "Line series: Configuring appearance" tutorial.
Using D3 smoothing
If the three smoothed line series choices does not fit our requirements, we have an option of using various smoothing algorithms bundled with d3-shape library.
Since those are not bundled with amCharts, you may need to load load them as modules from d3-shape npm package or compiled JS binaries from some CDN:
import * as d3 from "https://cdn.skypack.dev/d3-shape@3";
<script src="https://cdn.jsdelivr.net/npm/d3-shape@3"></script>
Then it's just as easy as setting curveFactory on your regular LineSeries:
let series = chart.series.push(
  am5xy.LineSeries.new(root, {
    name: "Series",
    xAxis: xAxis,
    yAxis: yAxis,
    valueYField: "value",
    valueXField: "date",
    curveFactory: d3.curveBumpX
  })
);
var series = chart.series.push(
  am5xy.LineSeries.new(root, {
    name: "Series",
    xAxis: xAxis,
    yAxis: yAxis,
    valueYField: "value",
    valueXField: "date",
    curveFactory: d3.curveBumpX
  })
);
See the Pen amCharts 5: Using d3 curve factories by amCharts team (@amcharts) on CodePen.