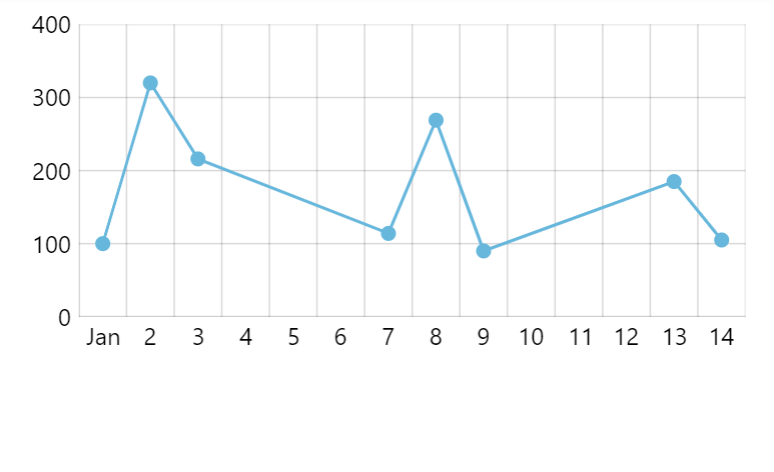
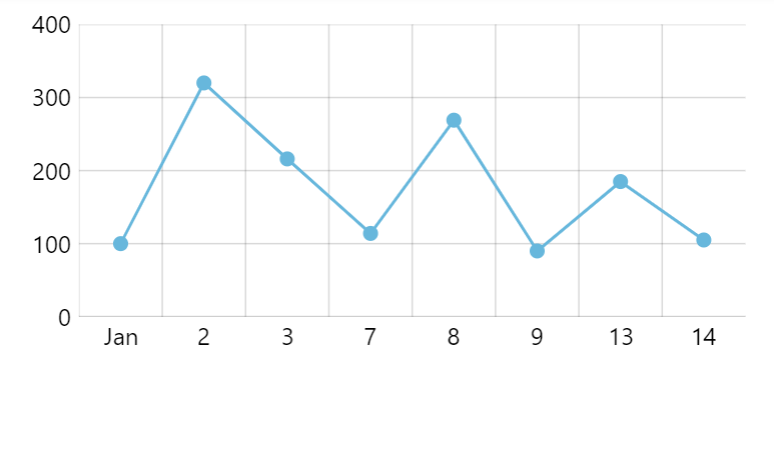
In a nutshell, a gapless date axis is the same as regular date axis (with some limitations), with data-less intervals removed from its scale.
Creating and configuring
Creating and configuring a gapless date axis works exactly the same as with regular date axis, except that instead of DateAxis object, we're instantiating GaplessDateAxis.
It still needs its baseInterval set, as well as renderer created and assigned to it:
let xAxis = chart.xAxes.push(
  am5xy.GaplessDateAxis.new(root, {
    baseInterval: { timeUnit: "day", count: 1 },
    renderer: am5xy.AxisRendererX.new(root, {})
  })
);
var xAxis = chart.xAxes.push(
  am5xy.GaplessDateAxis.new(root, {
    baseInterval: { timeUnit: "day", count: 1 },
    renderer: am5xy.AxisRendererX.new(root, {})
  })
);
For more configuration options - grid, label formatting, zooming, positions, etc. - please refer to "Date axis" tutorial.
Example
See the Pen amCharts 5: Gapless date axis by amCharts team (@amcharts) on CodePen.
Limitations
While gapless date axis implements most of the functionality from a regular date axis, some settings are not supported. Here's the list of date axis settings that are not supported:
startLocationendLocation
Category-based date axis
Gapless date axis replaces category-based axis which is still available for backwards compatibility, but should not be used to plot date-based data with gaps removed.
For more information, read "Category date axis".